OUR CUSTOMERS
Our customers trust our expertise


A holistic approach to IT & Marketing Solutions
Companies today are facing the challenges of an ever-changing online environment. We implement your ideas and solve your problems.
Our measuravbe success will convince you: We accompany you long-term and support your company with digital transformation.
With many years of experience in different industries, we are able to consult your company individually and implement custom-made IT solutions.
Our Satisfied Clients
A Selection of our Projects
Since 2015, we have been successfully serving companies of all industries and sizes in online marketing.

Featured Blog Posts
Recent news about MarTech, Digital Marketing, Web Solutions, and BI & Digital Analytics
EEAT: What does Google's concept mean for SEO?
Google's EAT concept was supplemented by another E a few months ago and is now called EEAT.
Read More
Google Consent Mode V2 required for EEA and UK business until March 6th 2024
What obligations exist in Consent Mode.
Read More
.2547628775.png)
Accessibility and SEO: an inseparable link for success in the digital space
We show how important online accessibility is and how it works!
Read More
OUR PARTNERS
With the support of our partners, we provide the best solutions for your company.


Contact Us
Via contact form, e-mail or callGet in touch with us
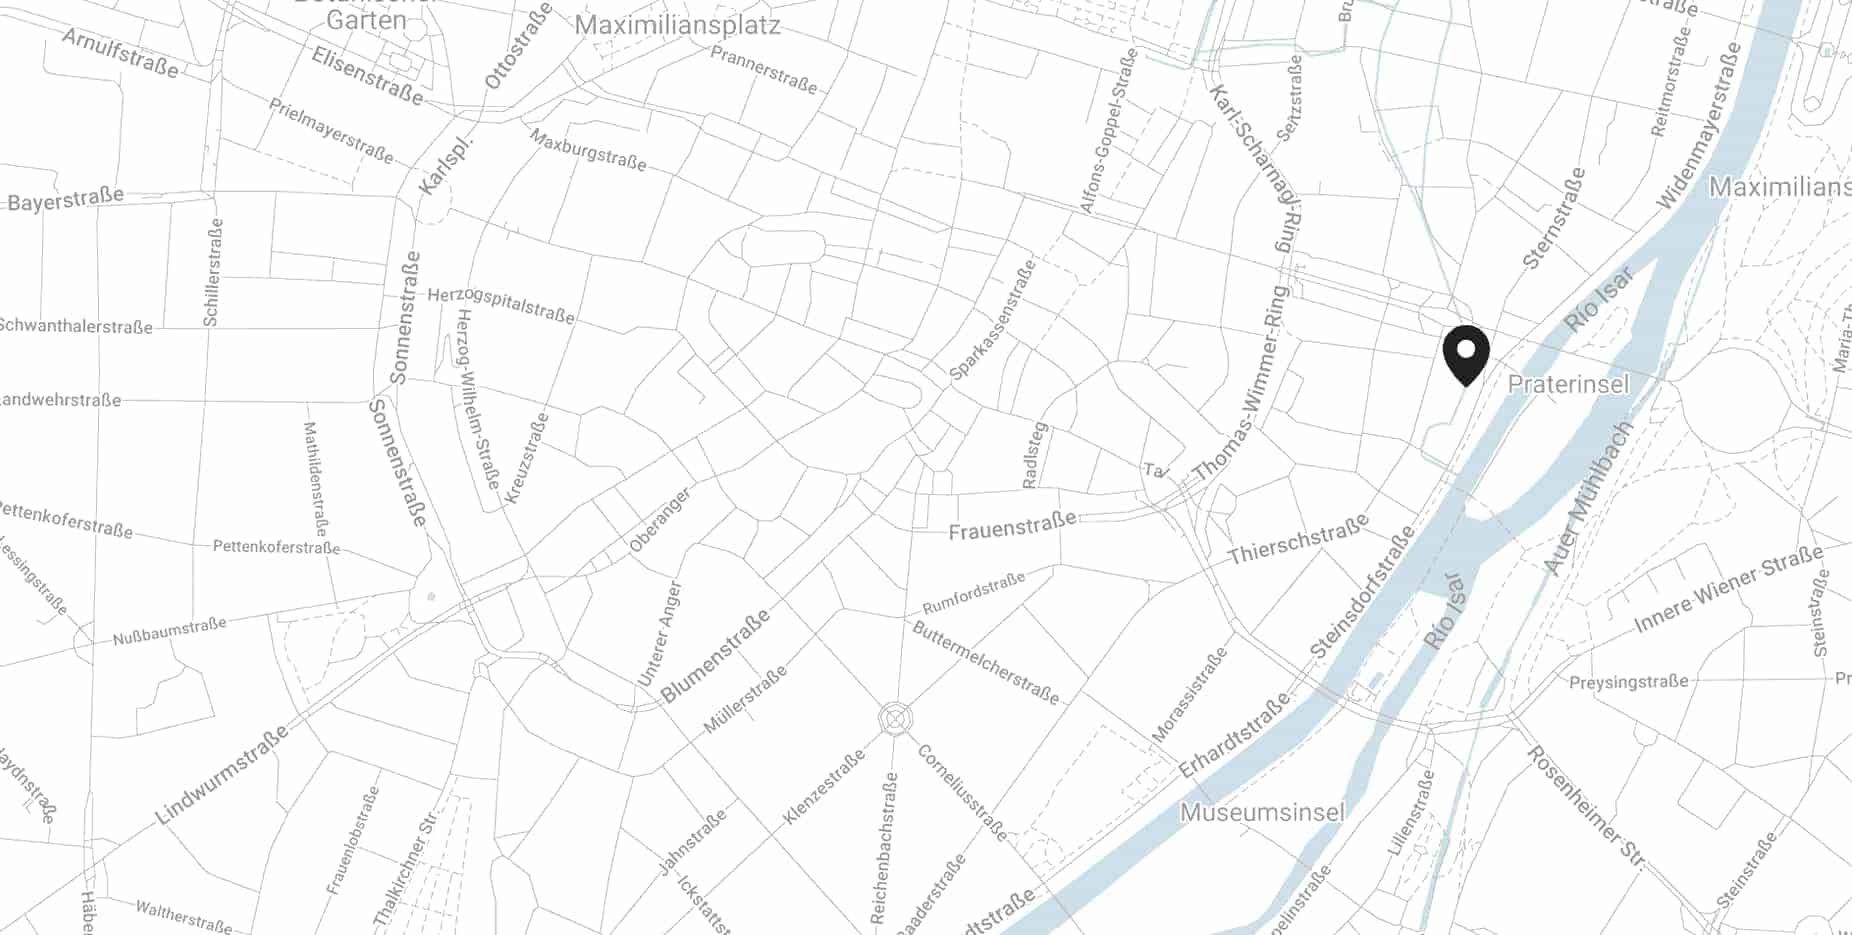
You can find our office in the heart of Munich:
We are social