Report Gallery
What are you looking for?
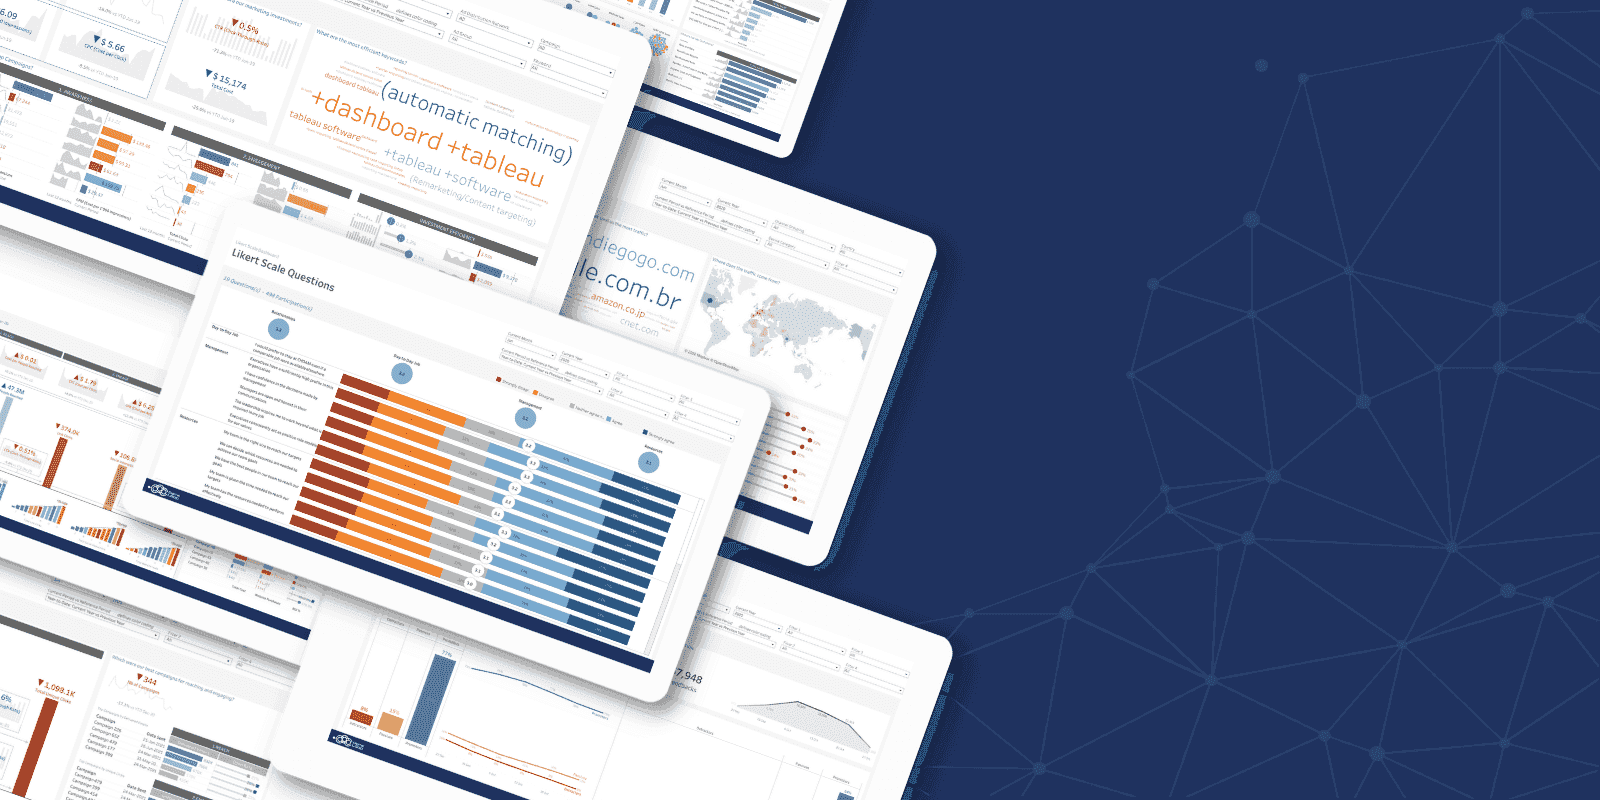
Are you looking for new ways of visualizing your company data? We show you innovative best-practice reports for web analytics, e-commerce, marketing and more. We use a range of tools but any solution presented here can be made in all BI tools that we offer.
Explore use cases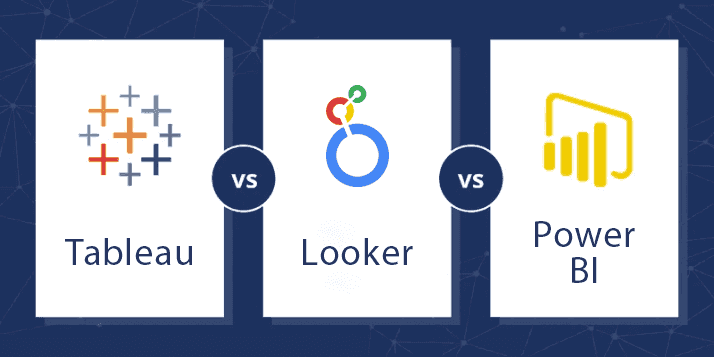
Deciding on the right BI tool for your company can be a challenge. We made this challenge easy with our live report comparison where you can see best practice reports made in Tableau, Microsoft PowerBI and Google Looker Studio. For more information, contact us and get a free first consultation!
View tool comparison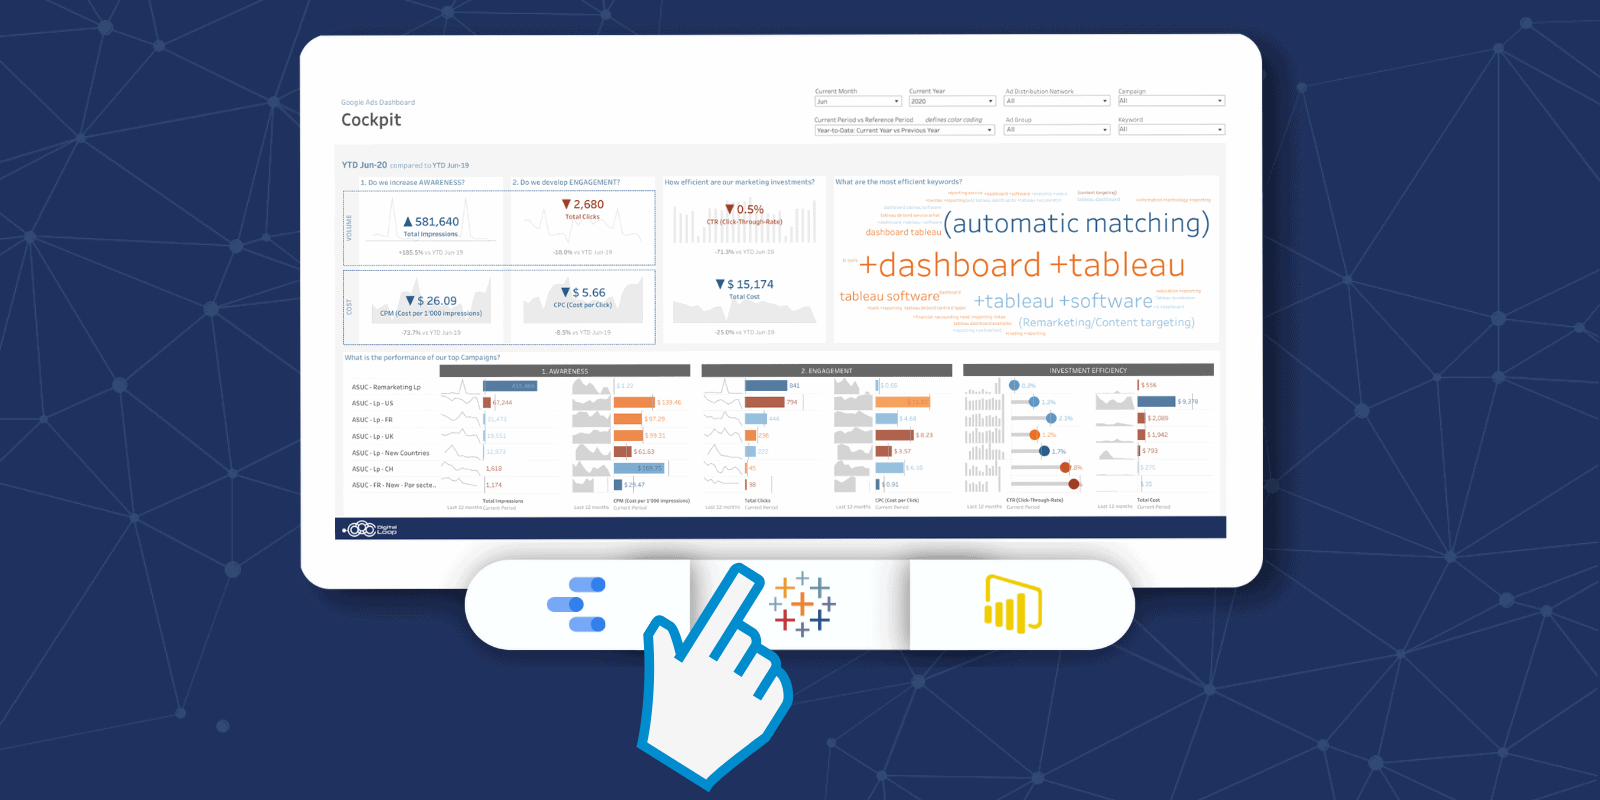
Best practice reports by use case
Get inspired with our best practice reports for every occasion. Get a report just like them with your data. Contact us now for a free consultation! We also offer a custom dashboard service, where we develop every metric with you based on the needs and inner workings of your company.
Web Analytics
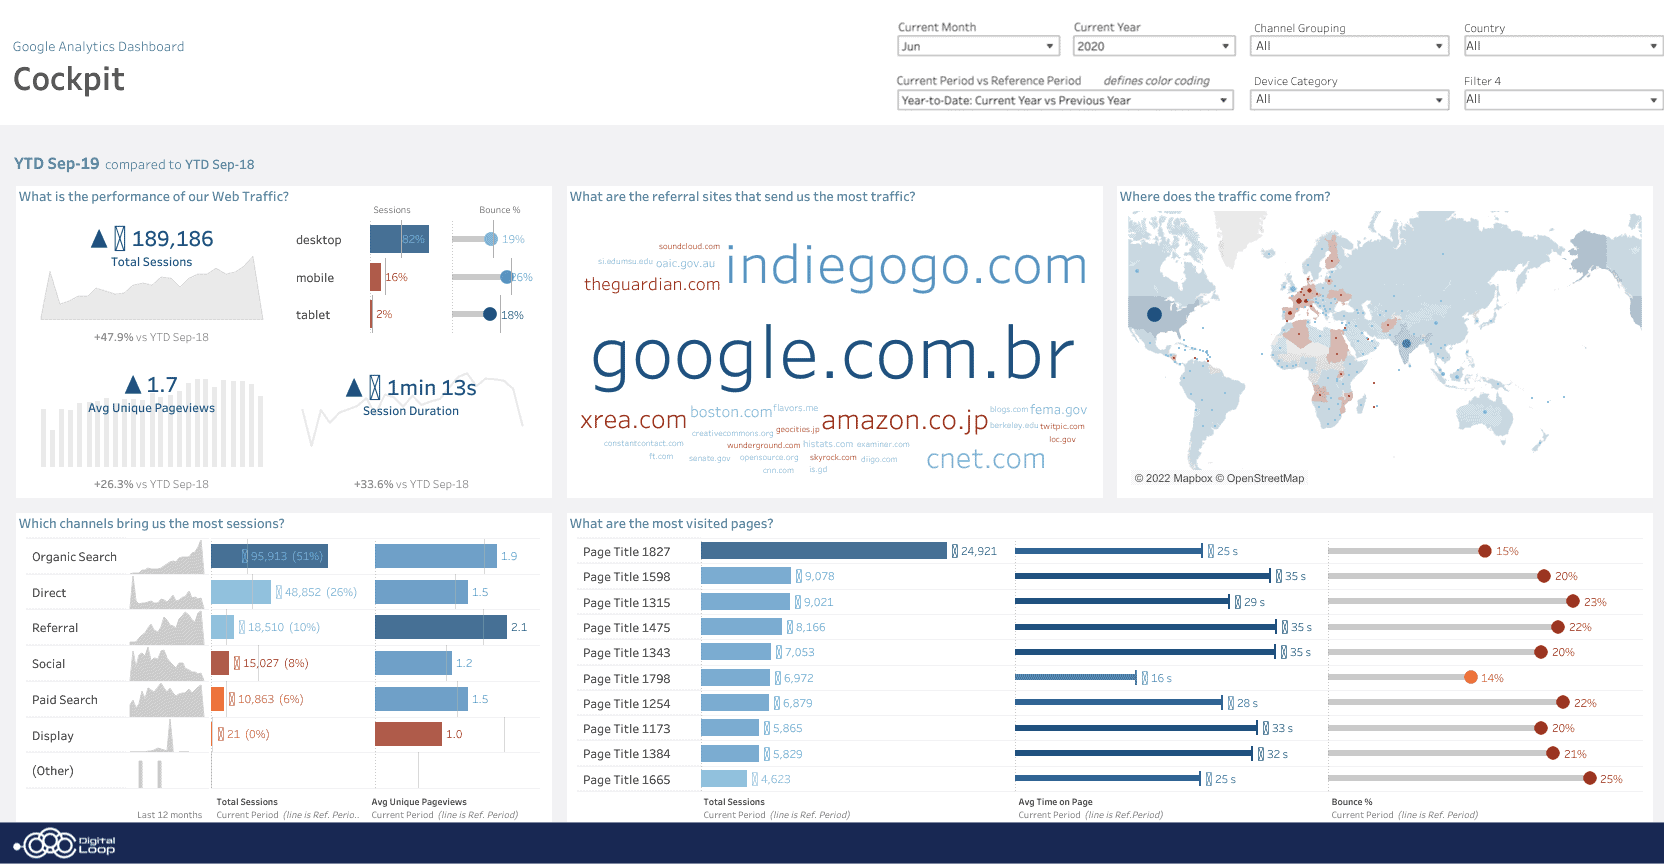
Google Analytics
Report in Tableau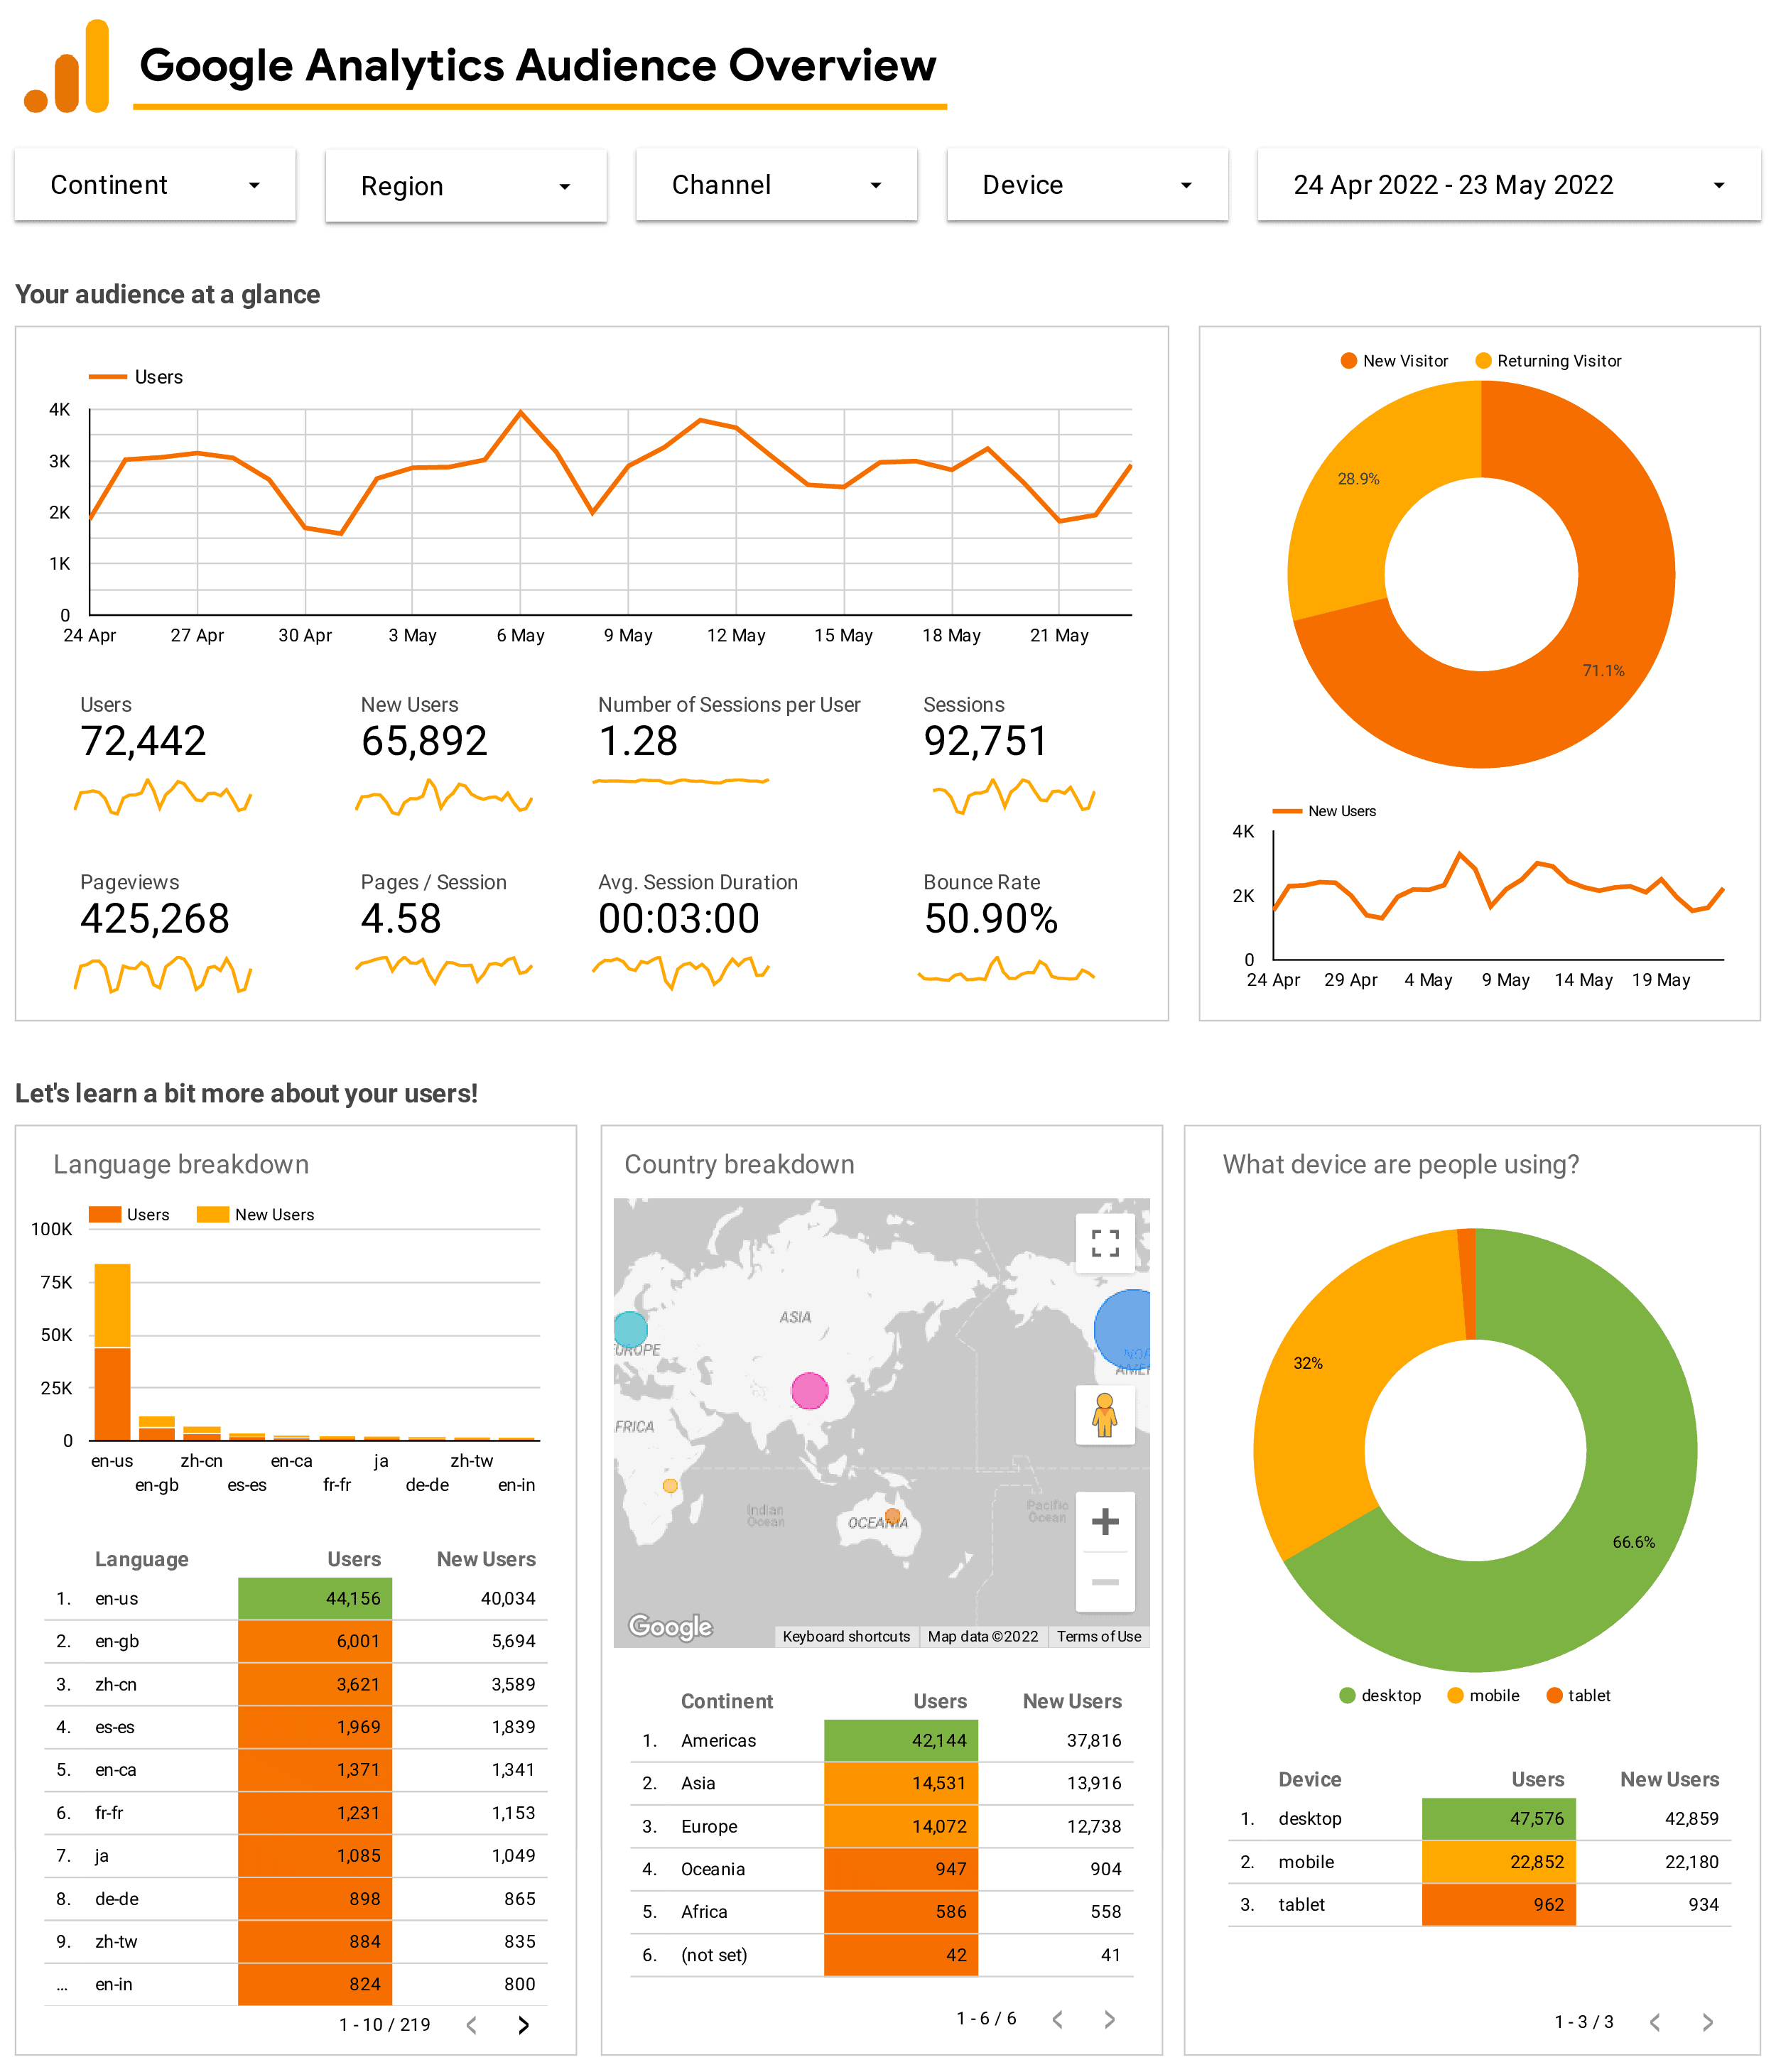
Google Analytics
Report in Looker Studio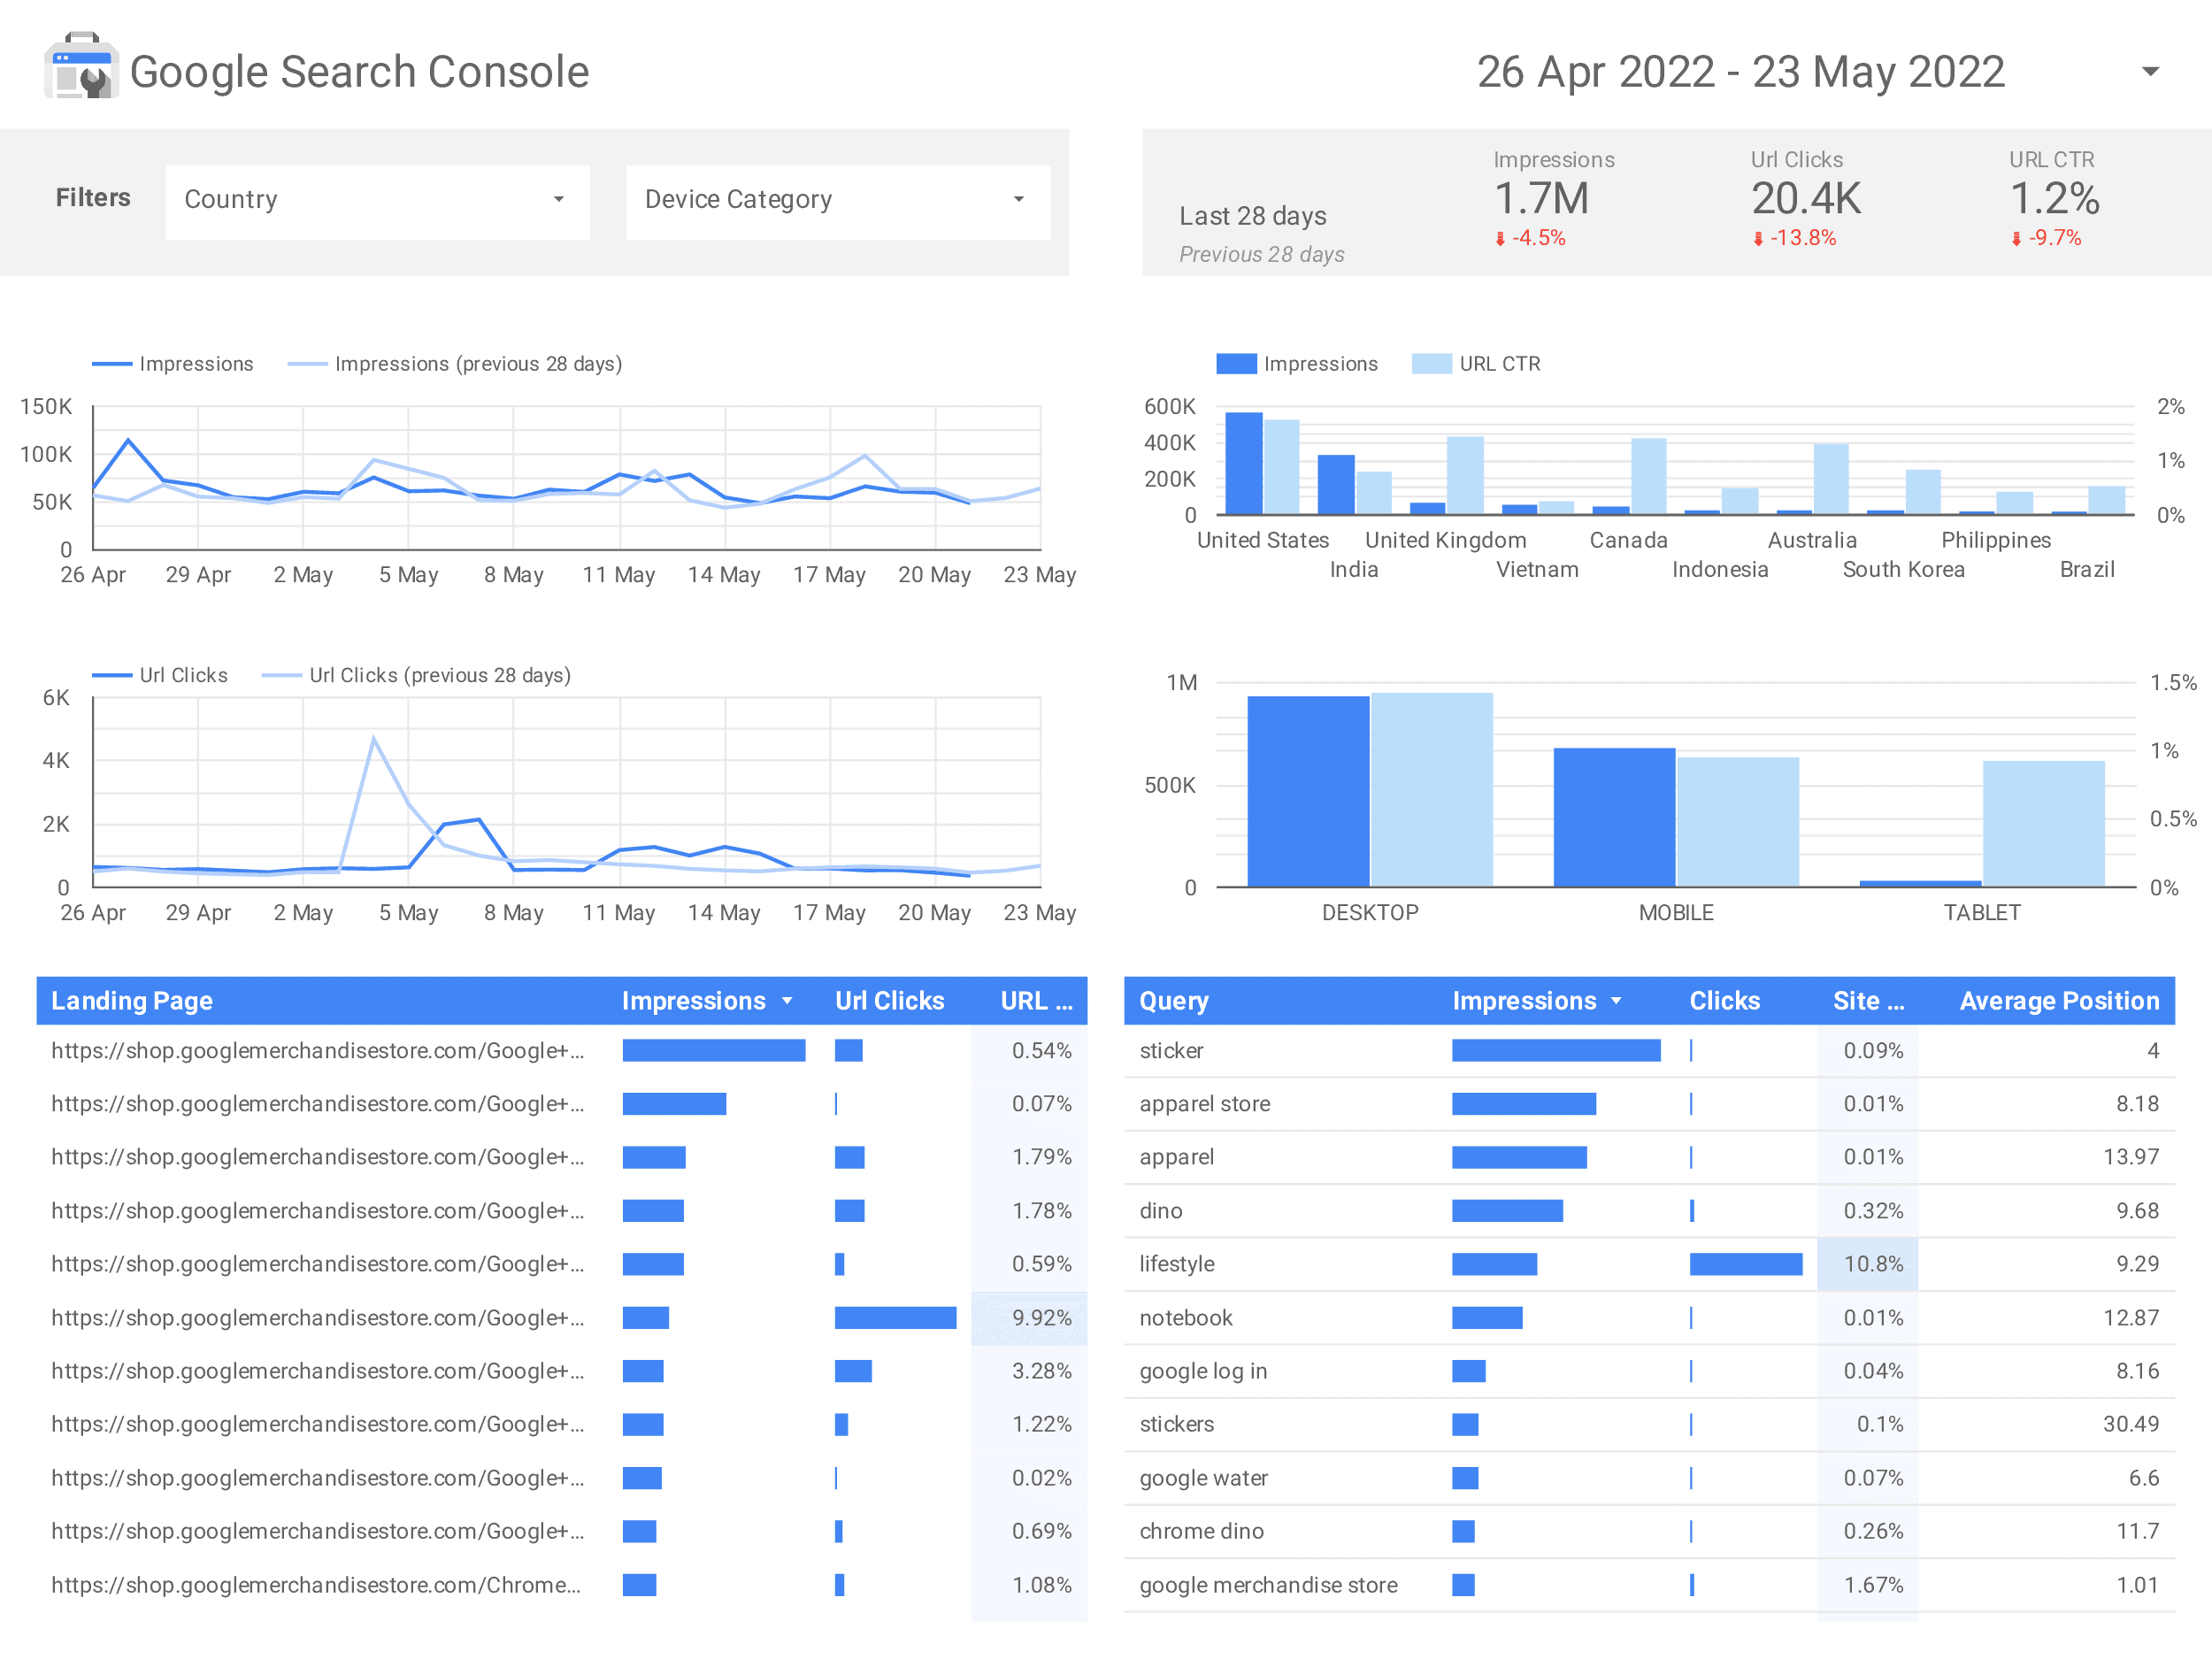
Google Search Console
Report in Looker StudioE-Commerce
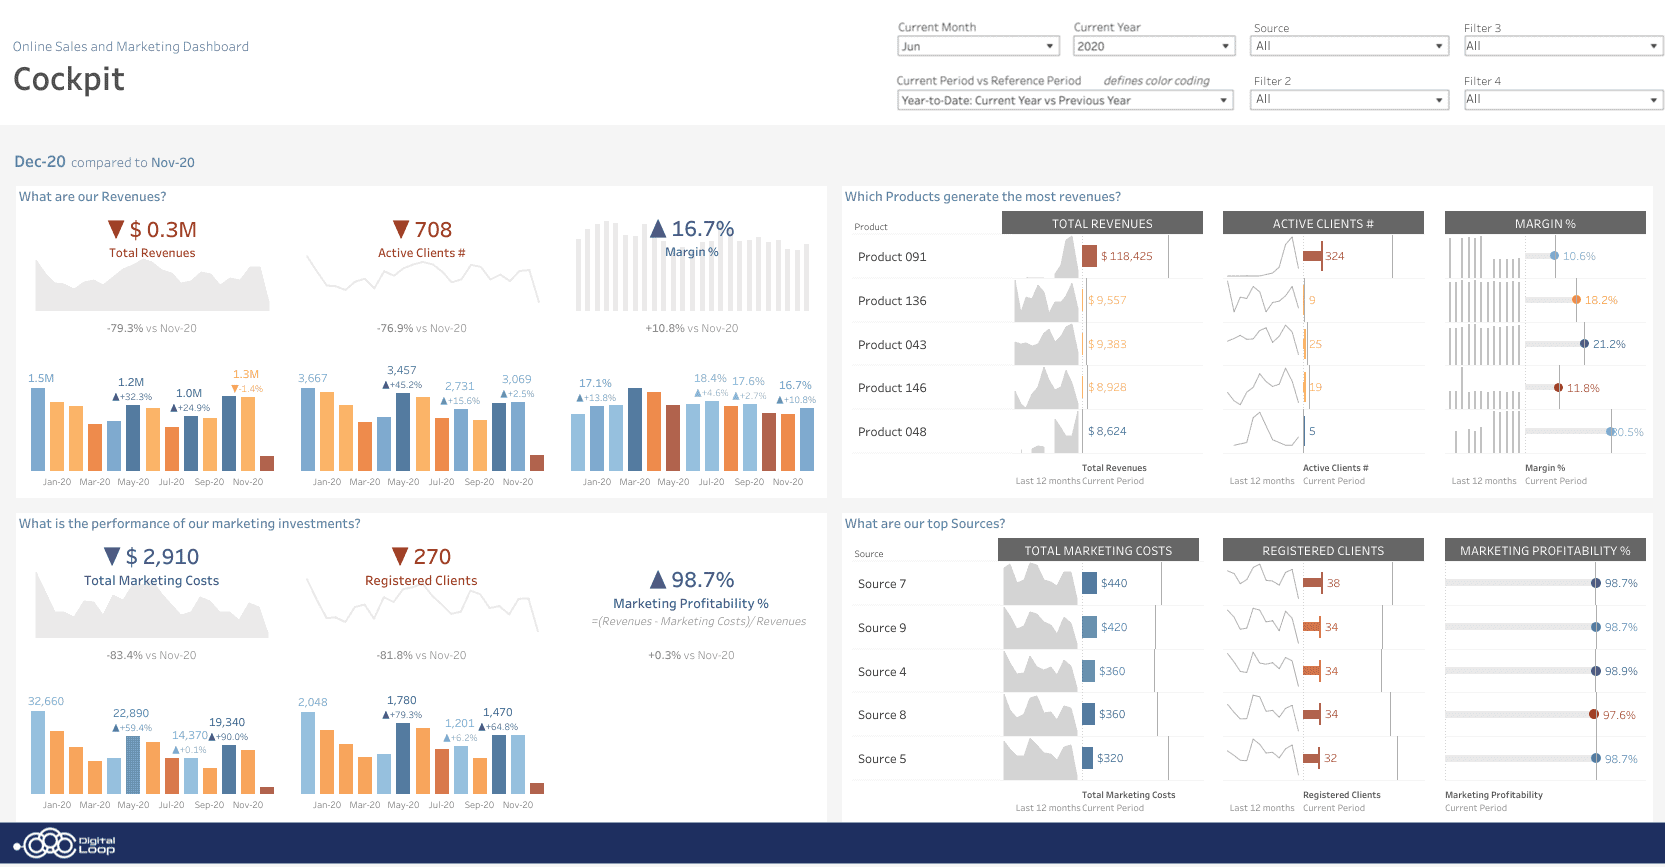
Online sales & marketing
Report in Tableau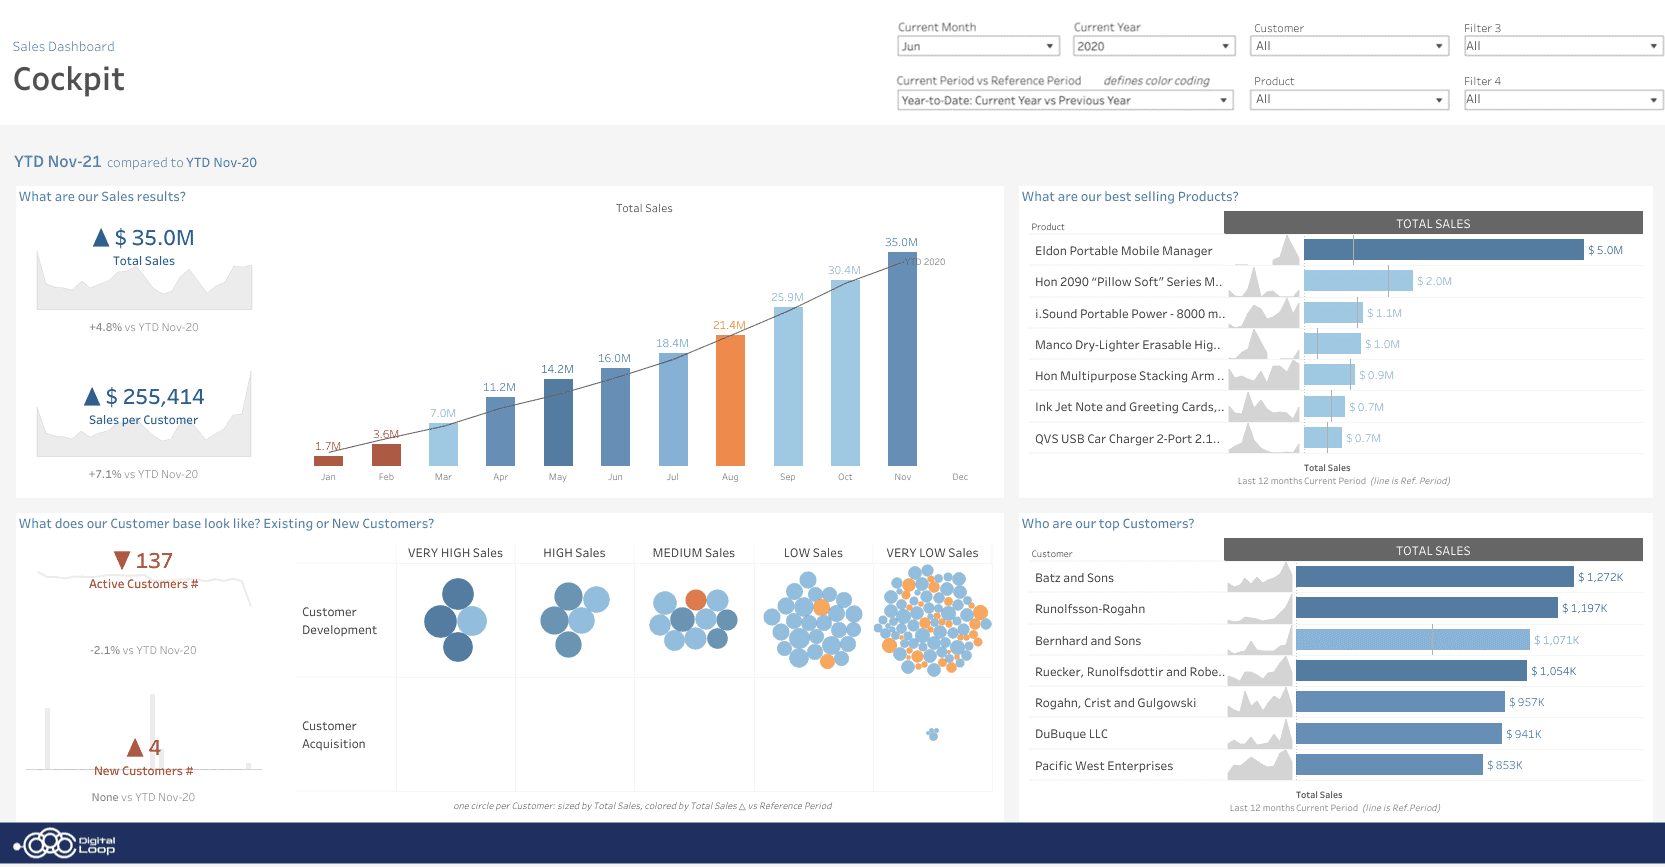
Sales
Report in Tableau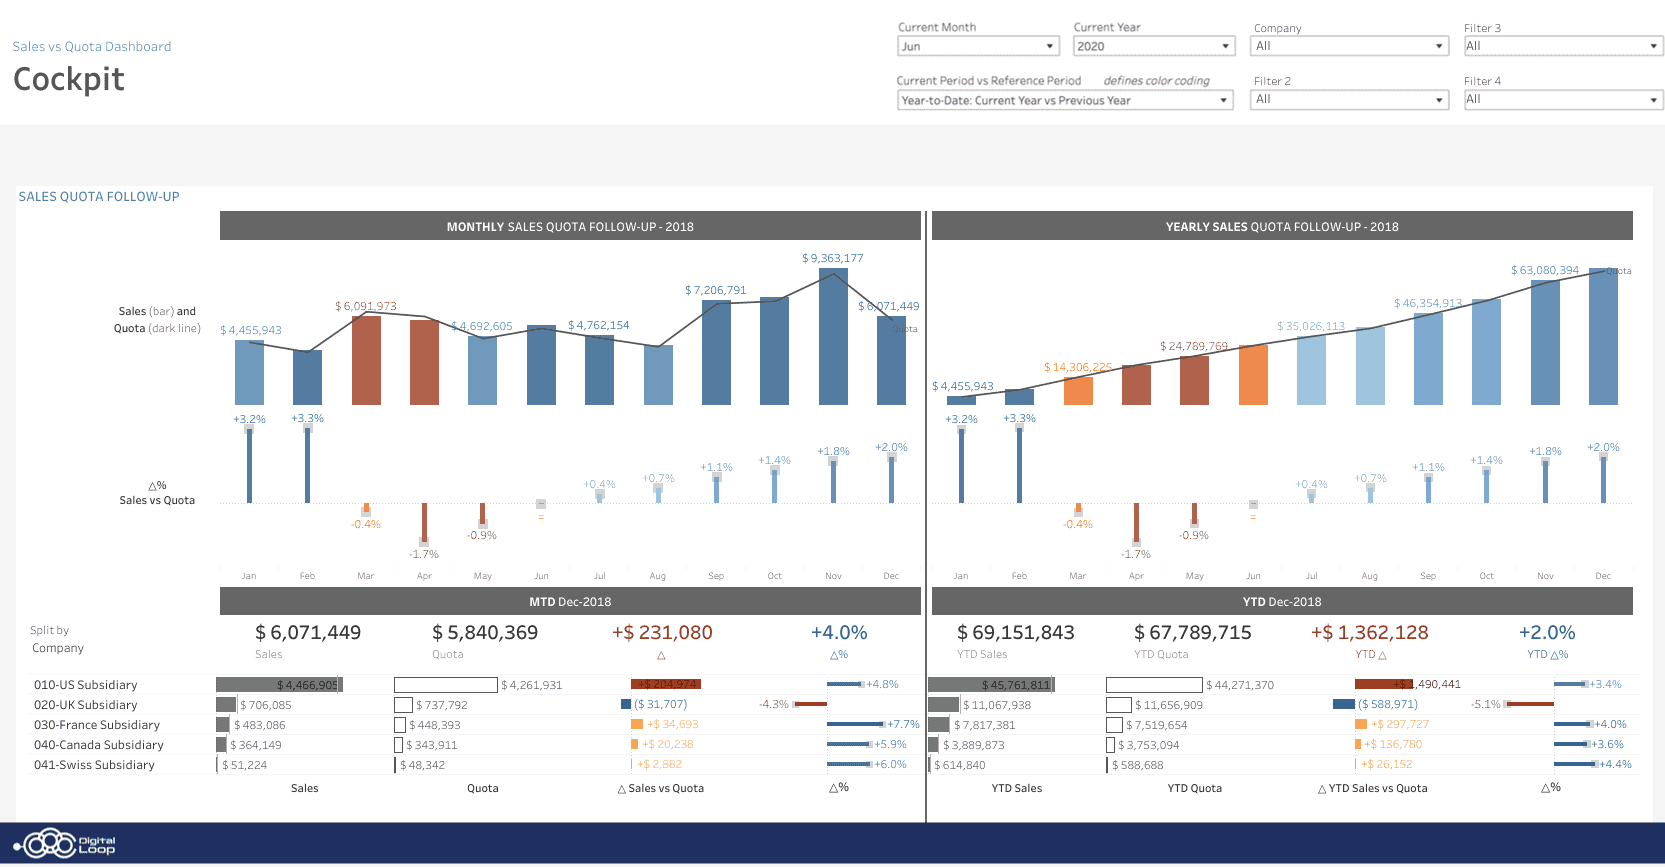
Sales vs Quota
Report in Tableau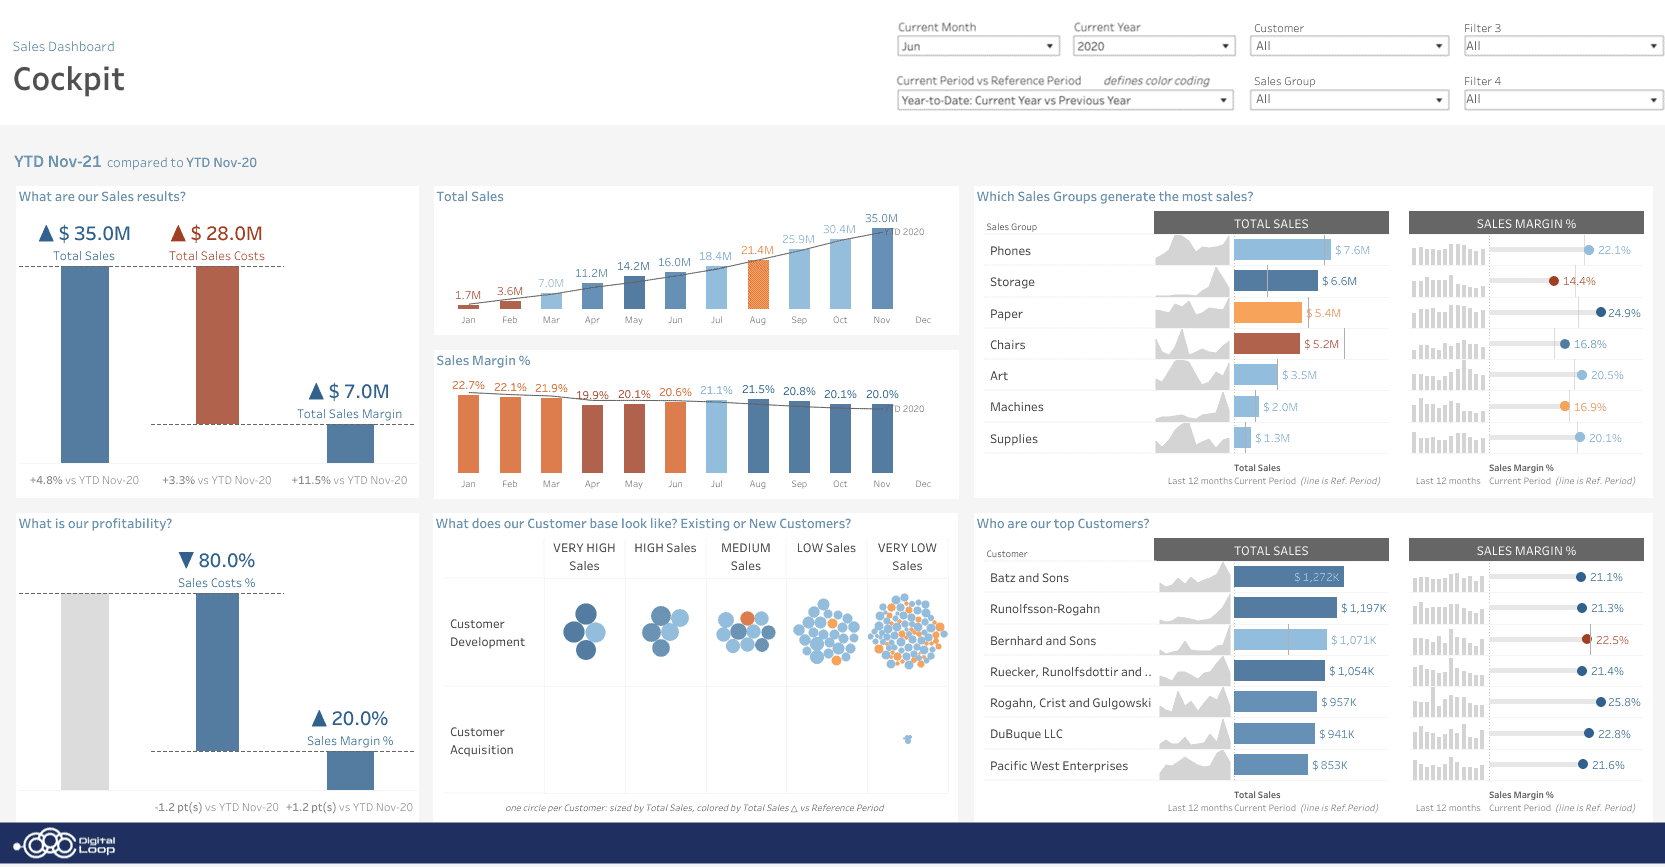
Sales incl. Target
Report in Tableau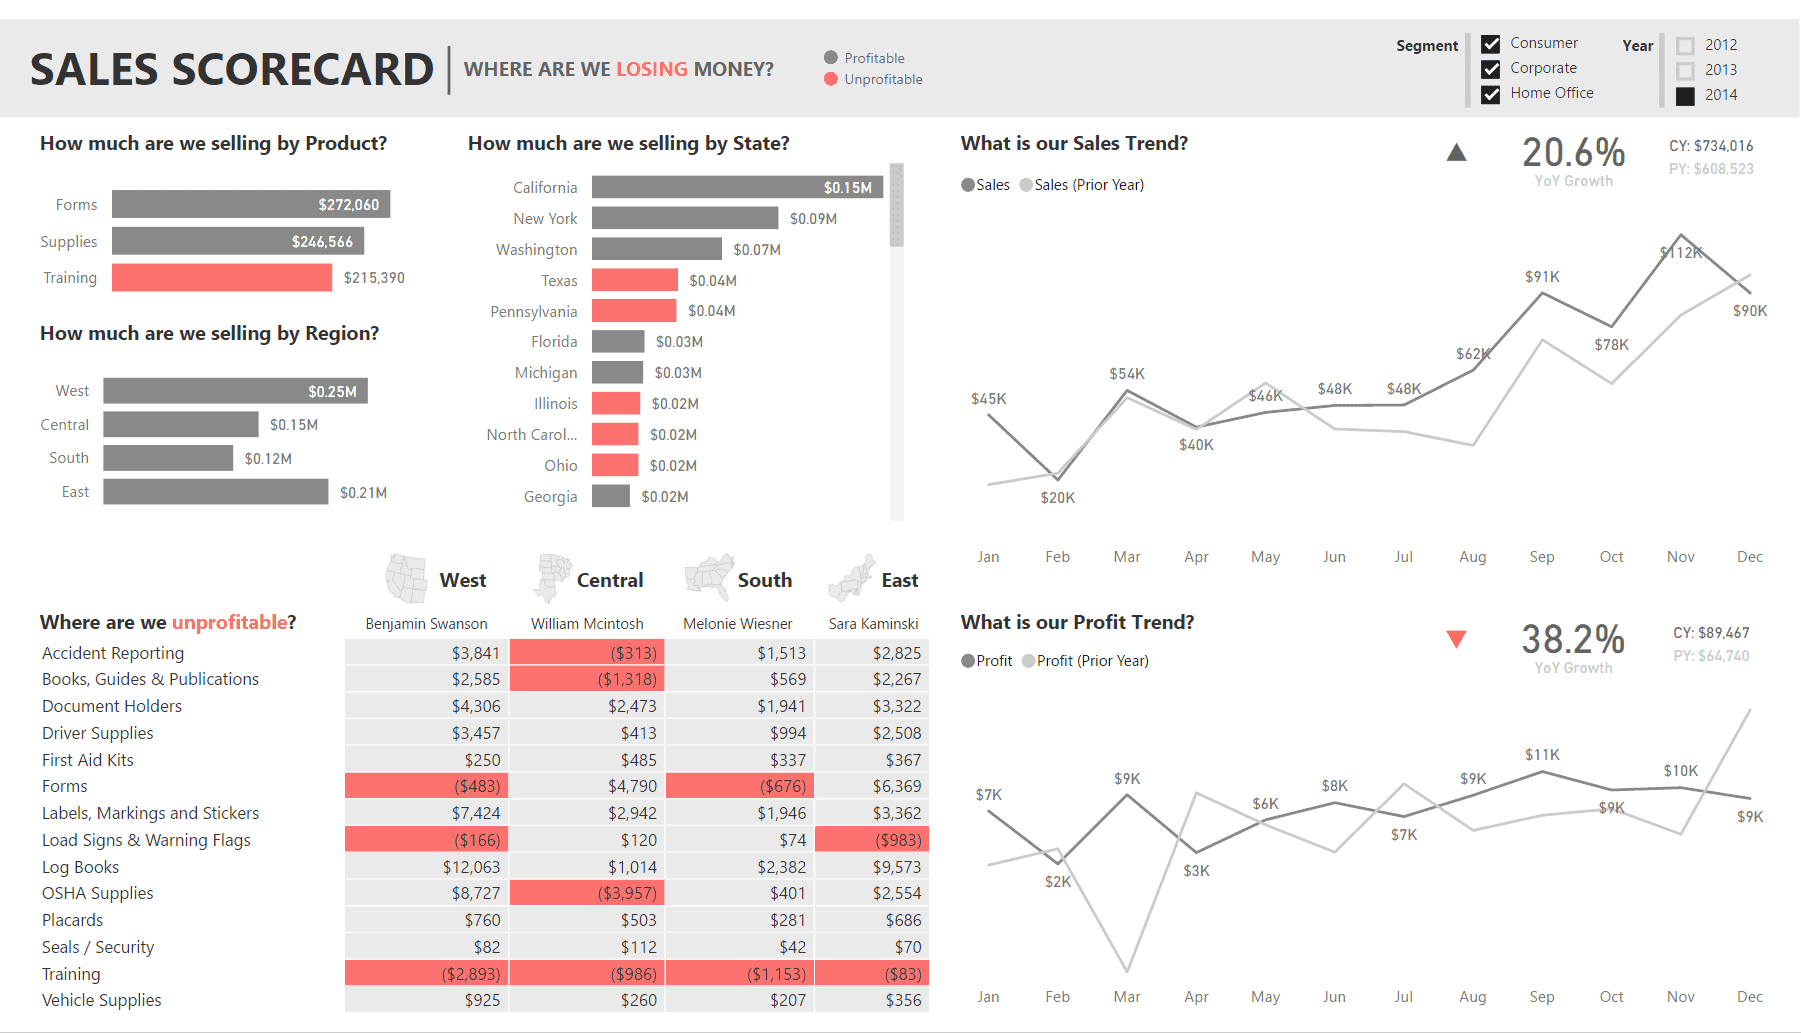
Sales
Report in Power BI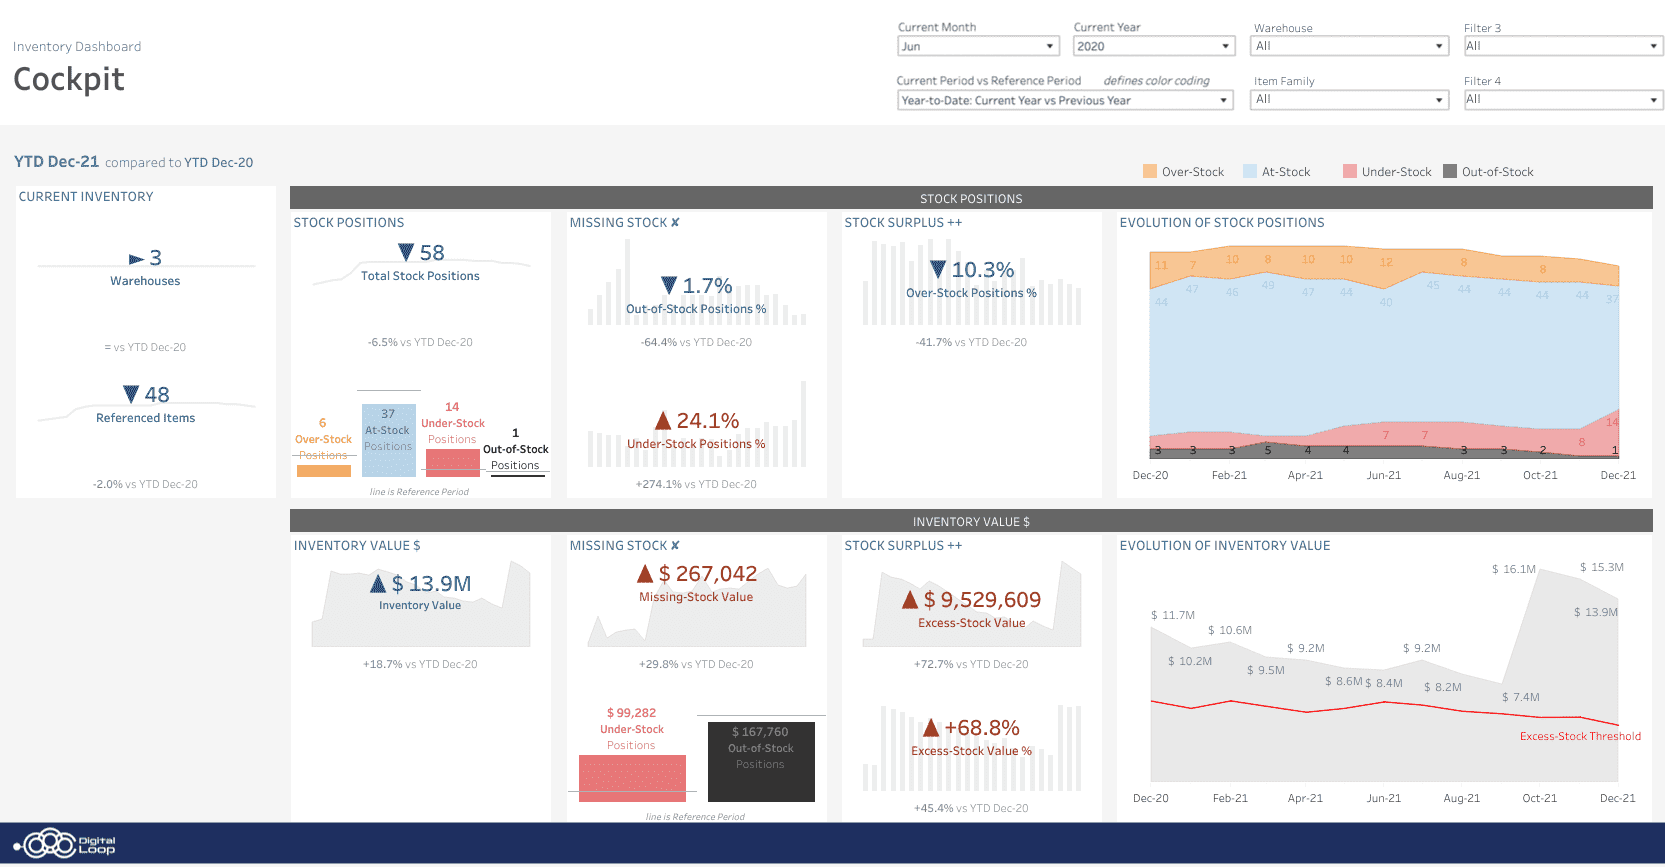
Inventory
Report in Tableau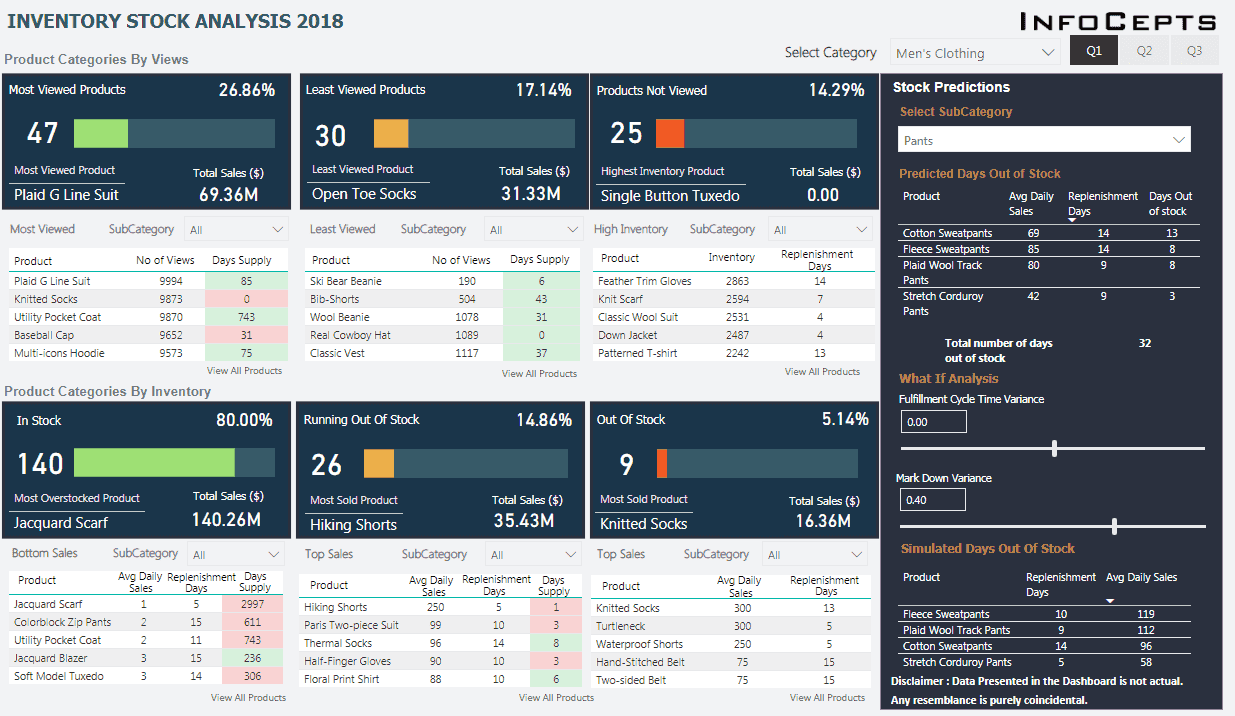
Inventory
Report in Power BIMarketing
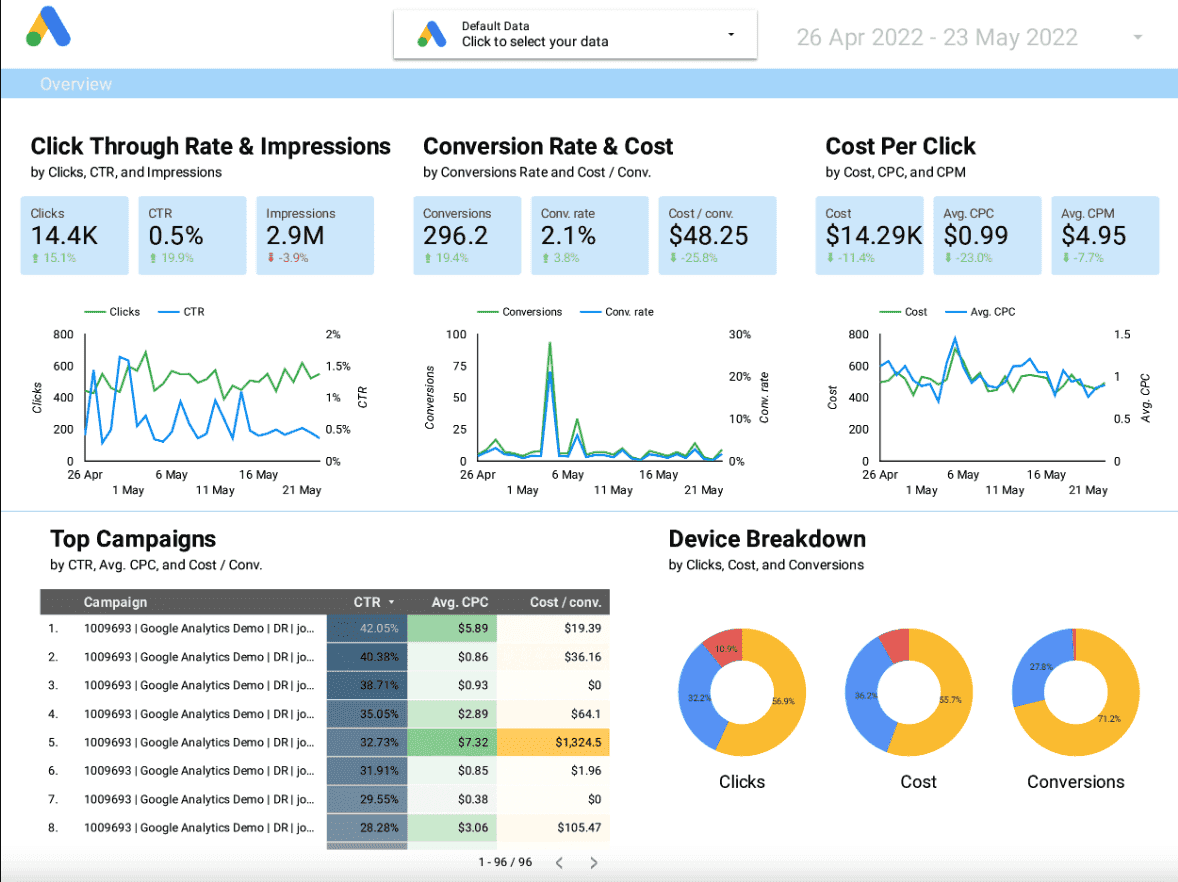
Google Ads
Report in TableauGoogle Ads
Report in Looker Studio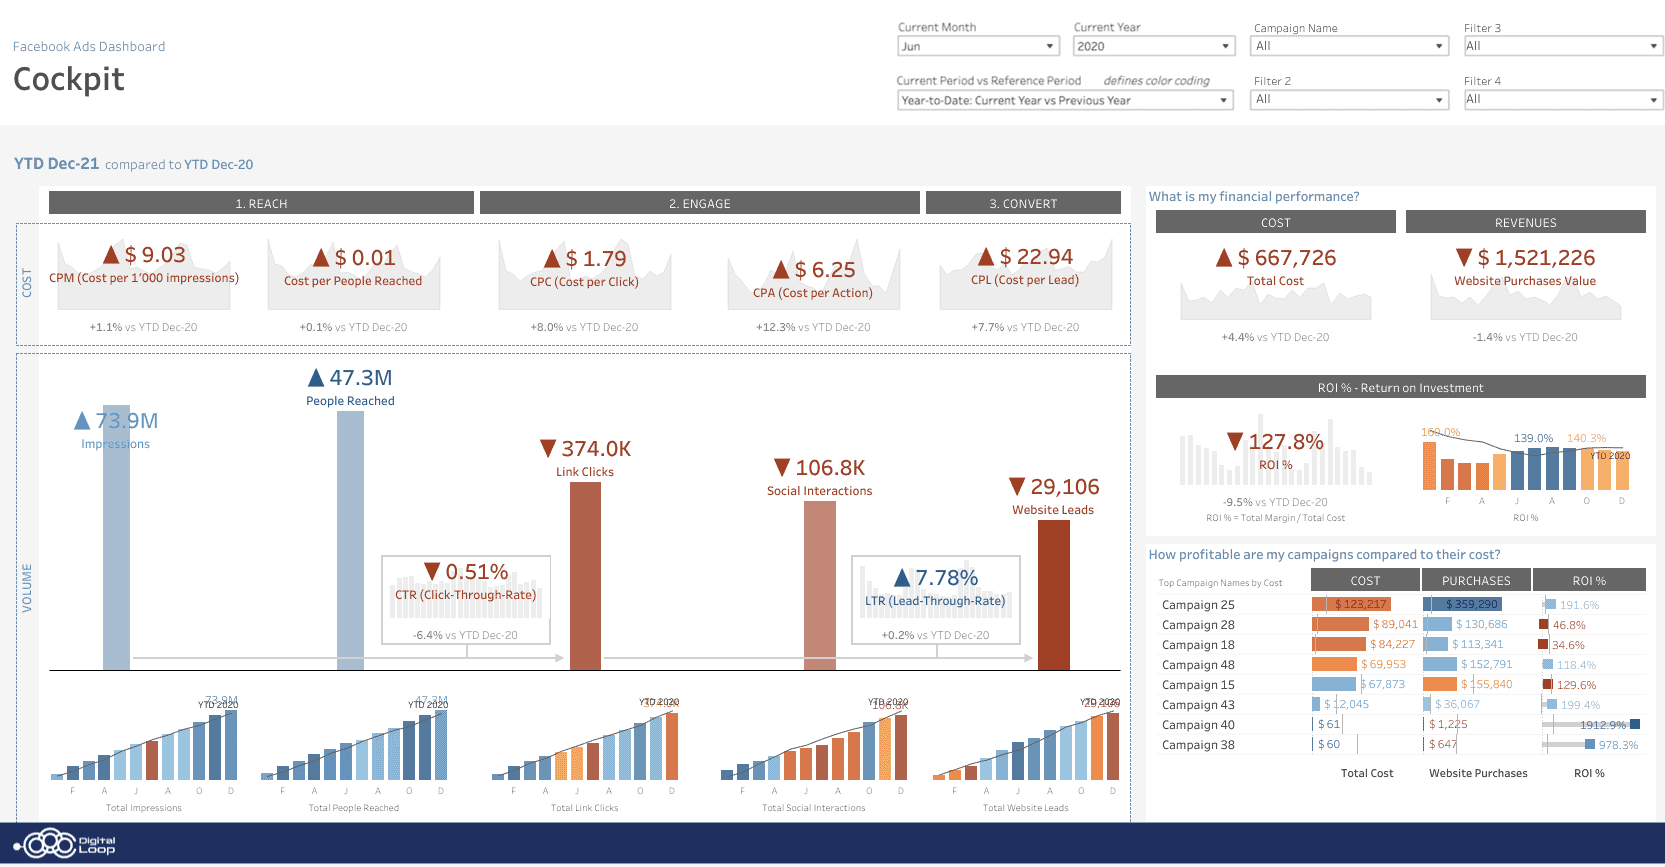
Facebook Ads
Report in Tableau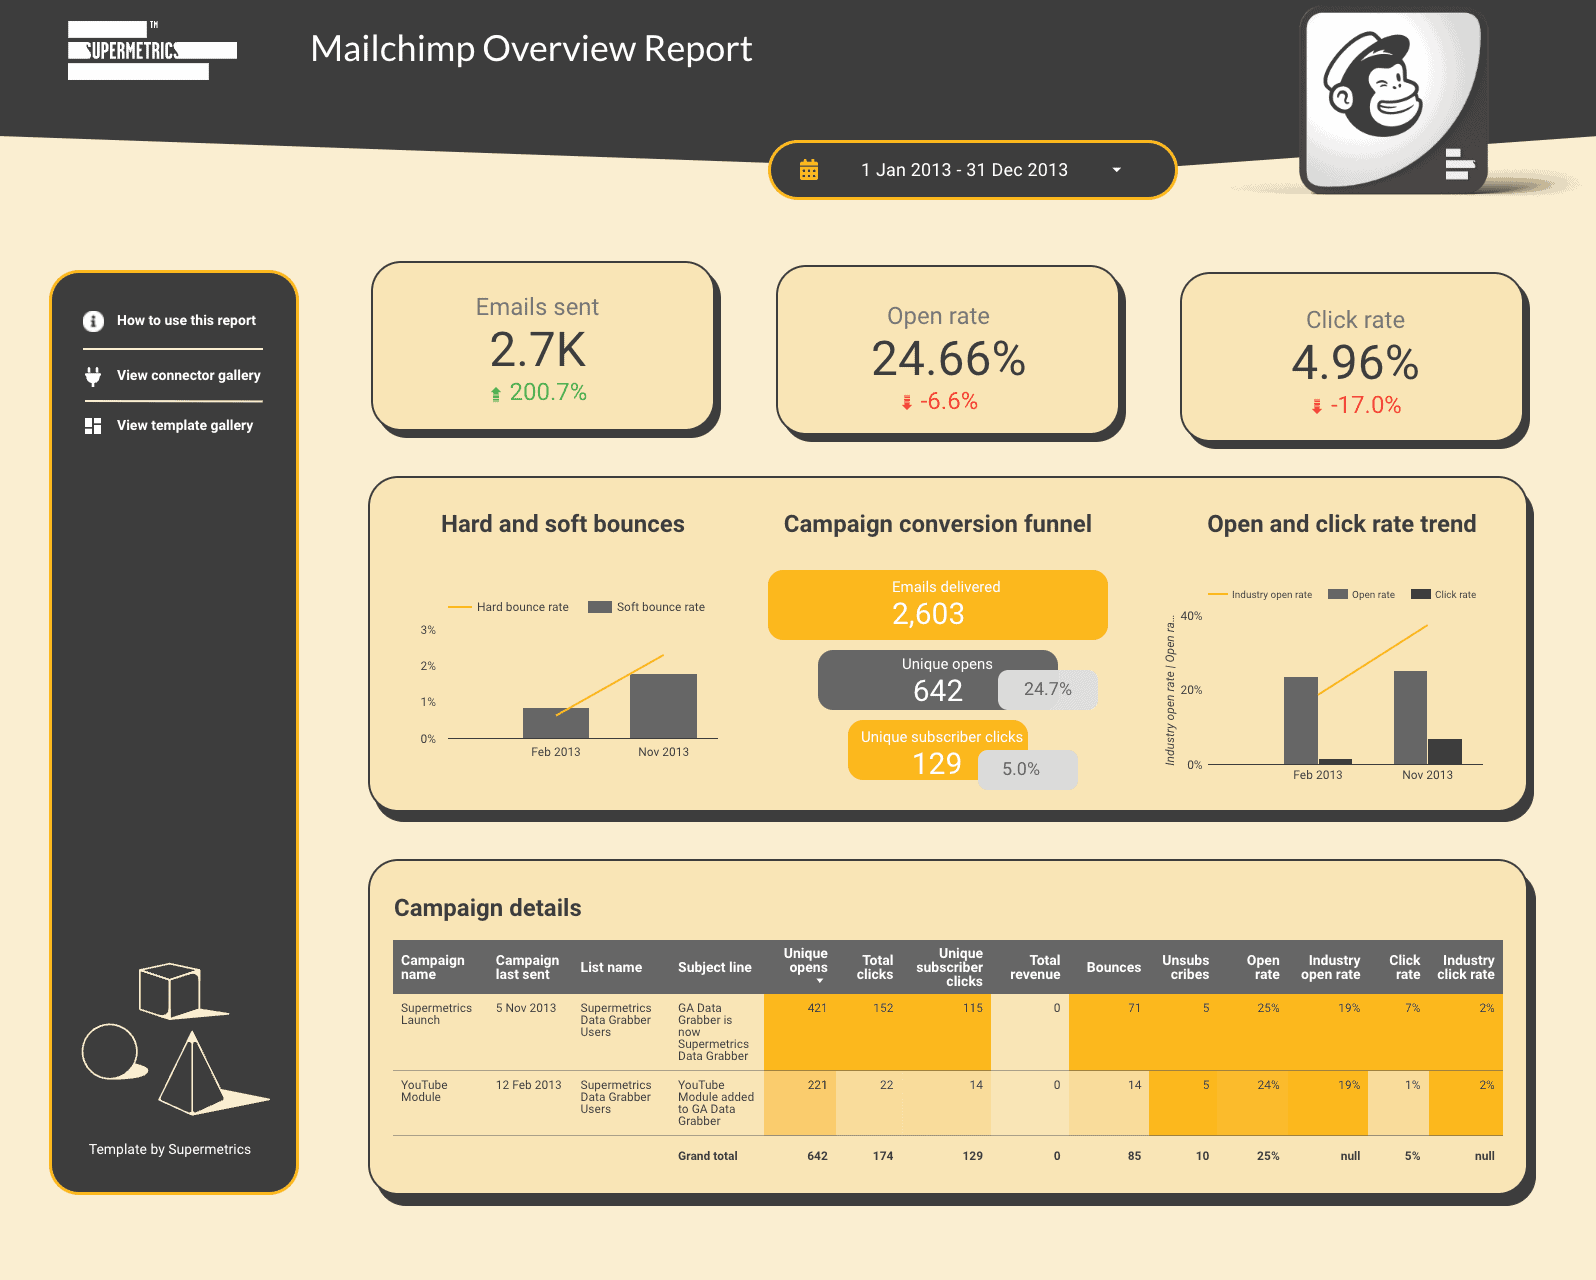
Email Marketing
Report in Looker Studio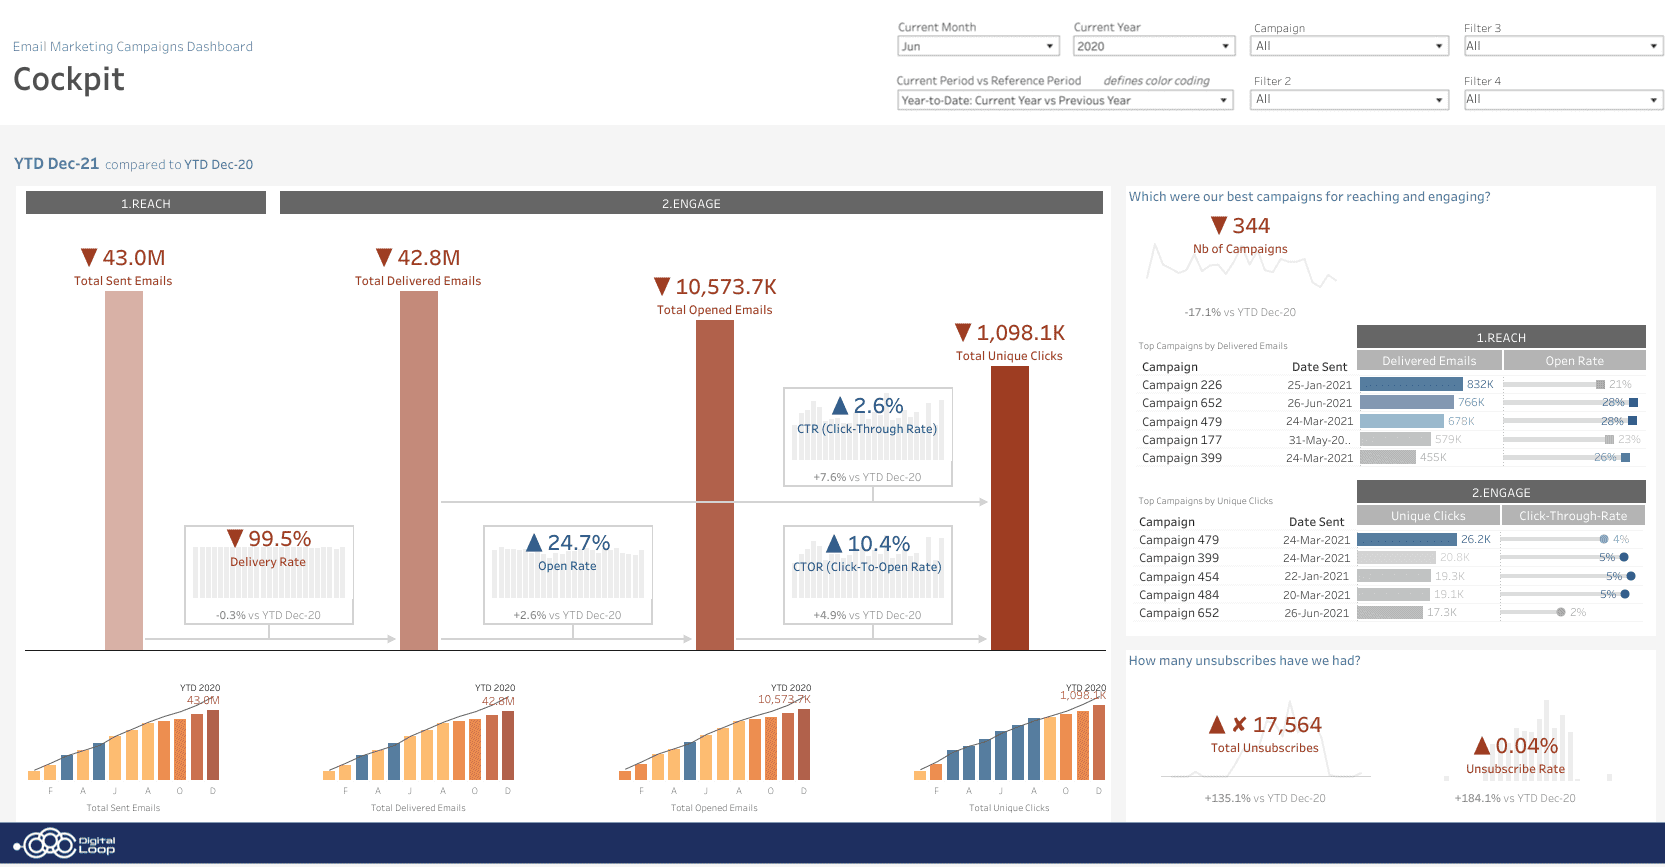
Email Marketing
Report in TableauMarket research
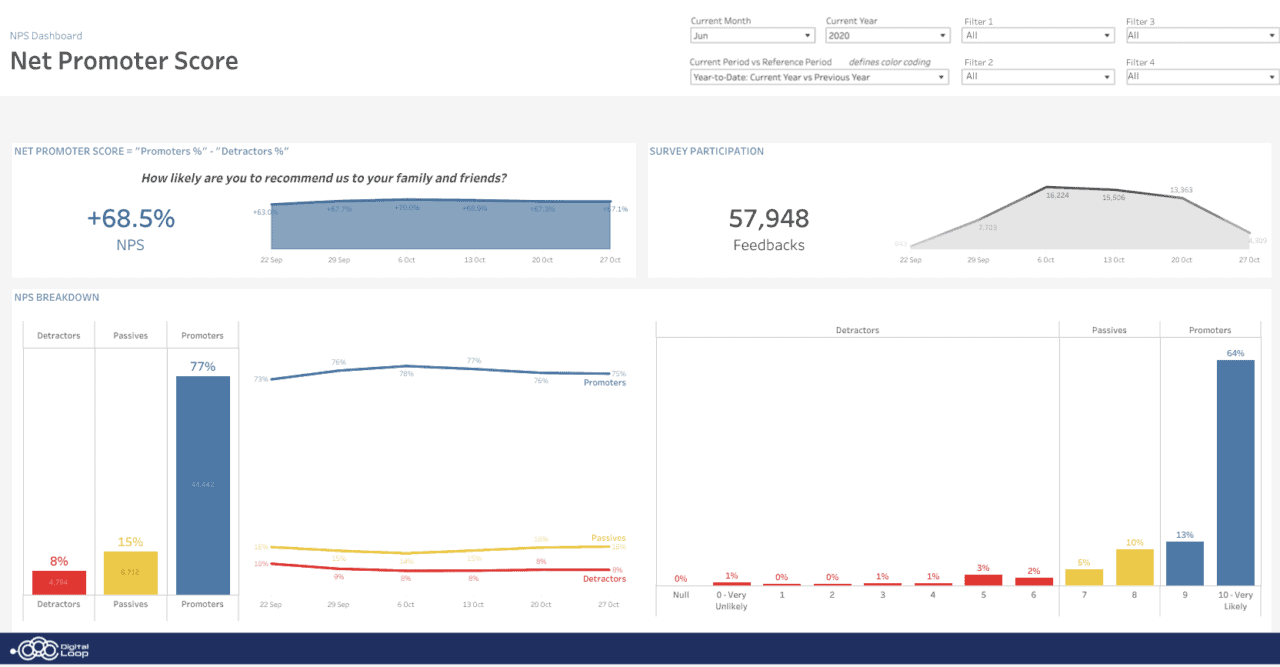
NPS
Report in Tableau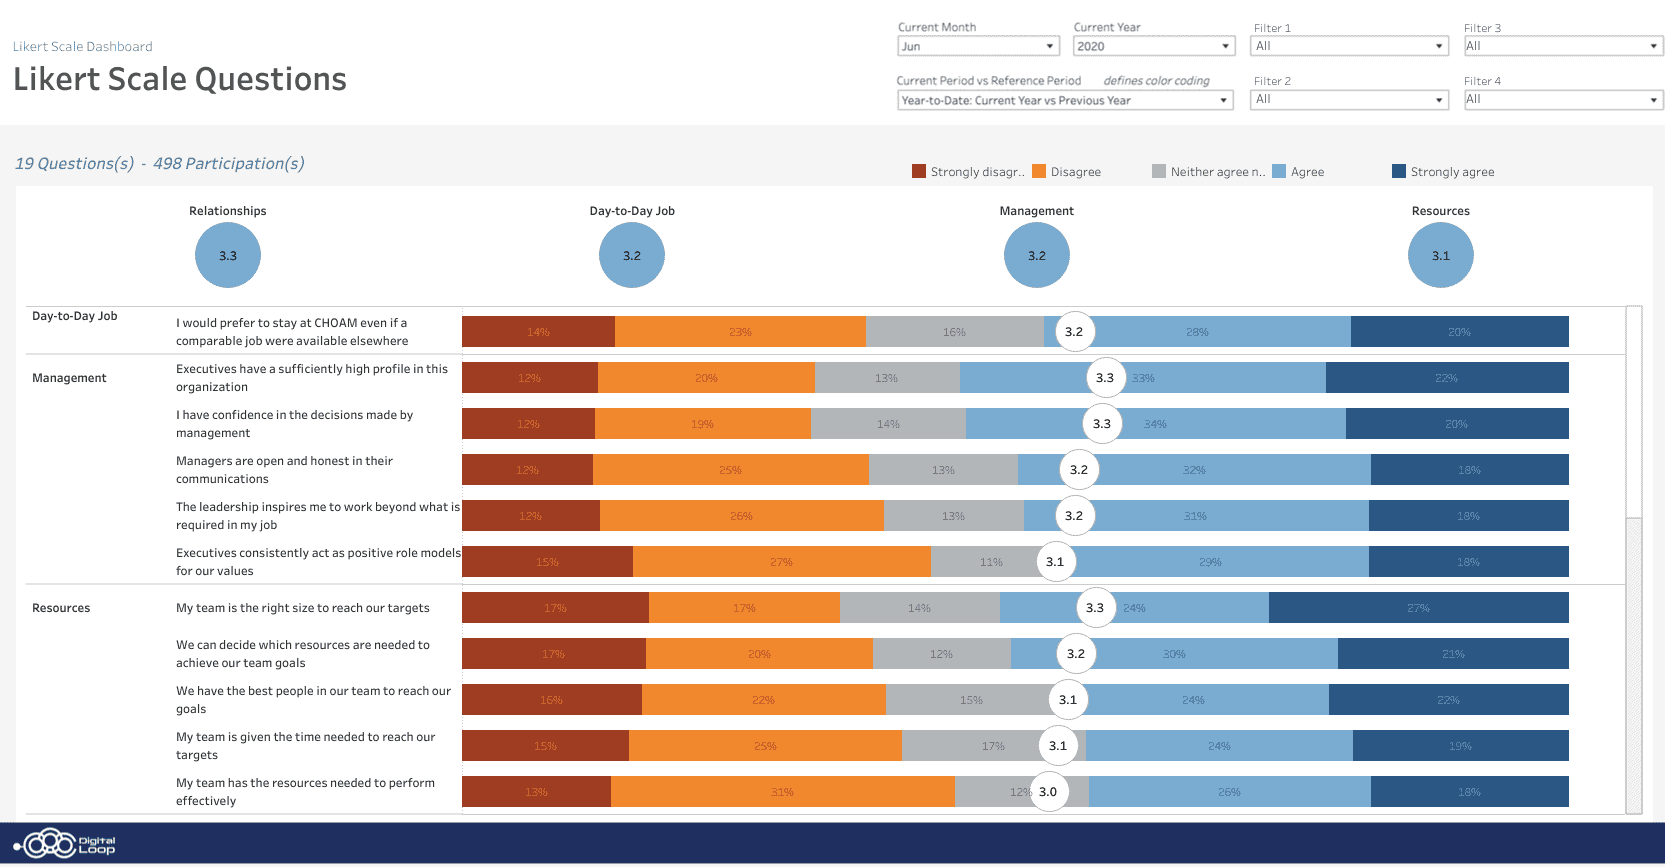
Likert Scale
Report in TableauChoose the right dashboard tool for you
There are many reasons to start using dashboards in a company. But where to start? We show you the three most advanced and most used tools that companies around the world love. Explore the embedded real-time reports to get a feel for the tools yourself and contact us for a full tool analysis based on your business case.
Comparing the tools
Tableau the established standard for data visualization and supports all types of projects well.
Long legacy
Strong support
Advanced graphs
Expensive
Complex setup
Looker Studio is a free tool that achieves fantastic results when dealing with online data.
Google ecosystem
Free tool
Fast data refresh
Limited capabilities
Focus on web data

PowerBI is a highly customizable data tool that is well integrated in the Microsoft ecosystem.
Affordable pricing
Excel integration
Python integration
Bulky UI
No Mac support
Try them yourself!
Frequently asked questions about dashboards
There are many reasons to start using dashboards in a company. But where to start? We show you the three most advanced and most used tools that companies around the world love. Explore the embedded real-time reports to get a feel for the tools yourself and contact us for a full tool analysis based on your business case.