This blog post is designed for analysts, BI specialists, and consultants. Rather than diving into deep technical tutorials, we will explore a strategic shift: how can you use AI as a high-speed engine to accelerate your projects?
A Side Note on “AI Analysis”
We acknowledge the ongoing debate between data purists and early adopters regarding whether Large Language Models (LLMs) can truly “analyze” data. Data professionals often give a firm “NO,” while adopters want to use LLMs for everything. At Digital Loop, after experimenting alongside our clients, our conclusion is: “Not yet, but we are very close.” We know that with the right setup (Retrieval-Augmented Generation (RAG), Agentic AI, workflow automation, and a robust data layer), LLMs can perform analysis. However, it isn’t yet as simple as asking ChatGPT or Claude, “What’s happening with my sales?”
In everyday operations, using LLMs for Business Intelligence isn’t about asking “Can AI analyze this for me?”
It’s about “How can an LLM help me build this?”
Use Case 1: Synthetic Datasets
The first hurdle in any new analytics project is data access. Whether you are building a dashboard, a custom transformation tool, or an insight engine, getting your hands on real data often takes weeks of alignment and security approvals.
Furthermore, stakeholders often have a limited understanding of what specific data points are required for their vision. This is where the broad knowledge of an LLM is a game-changer. It can generate a comprehensive, realistic synthetic dataset based on very limited input. It understands the necessary fields, logic, and hierarchies that fit a specific industry or use case.
- Example 1: An e-commerce beauty brand needs a monitoring solution that combines app usage data, server downtime logs, and advertising spend.
- Example 2: An educational portal wants to track tutor performance and course completion rates.
- Example 3: A car-sharing company wants to integrate weather patterns to test the logic for a dynamic pricing system.
In the past, building a Proof of Concept (PoC) for these scenarios was impossible without a lengthy discovery phase and cross-functional data exports. Now, an LLM can produce these datasets almost instantly, allowing analysts and engineers to collaborate on a working prototype immediately.
We provide the LLM with the “skeleton” of the business: the departments, transaction types, and the key variables. The resulting dummy dataset isn’t meant to be 100% realistic or capture every edge case of a real-world database. Instead, it serves as a “logical mirror.” It provides just enough structure and data volume to test the user interface and the flow of insights. This allows us to validate the vision first, without getting bogged down in the data-cleaning hurdles that usually stall a project before it even begins.
Use Case 2: Rapid Prototyping
The second and perhaps the most impactful use case is rapid prototyping.
Whether you are an analyst suggesting a new report to your team, a team lead responding to a sudden request from an executive, or a consultant pitching a solution to a client, an interactive prototype stands out far more than a slide deck.
Instead of spending hours building a dummy dashboard in Power BI or Tableau, which still requires you to manually prep an input file, you can use an LLM to generate a fully responsive, dynamic HTML page. This isn’t just a static layout; it’s a high-fidelity prototype that looks and behaves like a real, finished dashboard, complete with interactive charts, navigation menus, and hover effects. You can show this on any device or send it as an attachment, allowing your counterpart to play around with the filters and get a feel for the end product.
The Workflow:
- Input: Take the raw requirements from the stakeholder.
- Data: Use the LLM to generate the matching dummy dataset.
- Context: Add your expert input, corporate style guidelines, and describe your target audience.
- Generation: Have the LLM build the interface.
By using this approach, you save hours on the initial visualization. This allows you to focus on more important details that will turn this mock-up into a real, data-connected product.
Prototyping Examples:
- A cockpit interface for a supervisor of insurance sales agents.
First, how Gemini visualized this in an image:
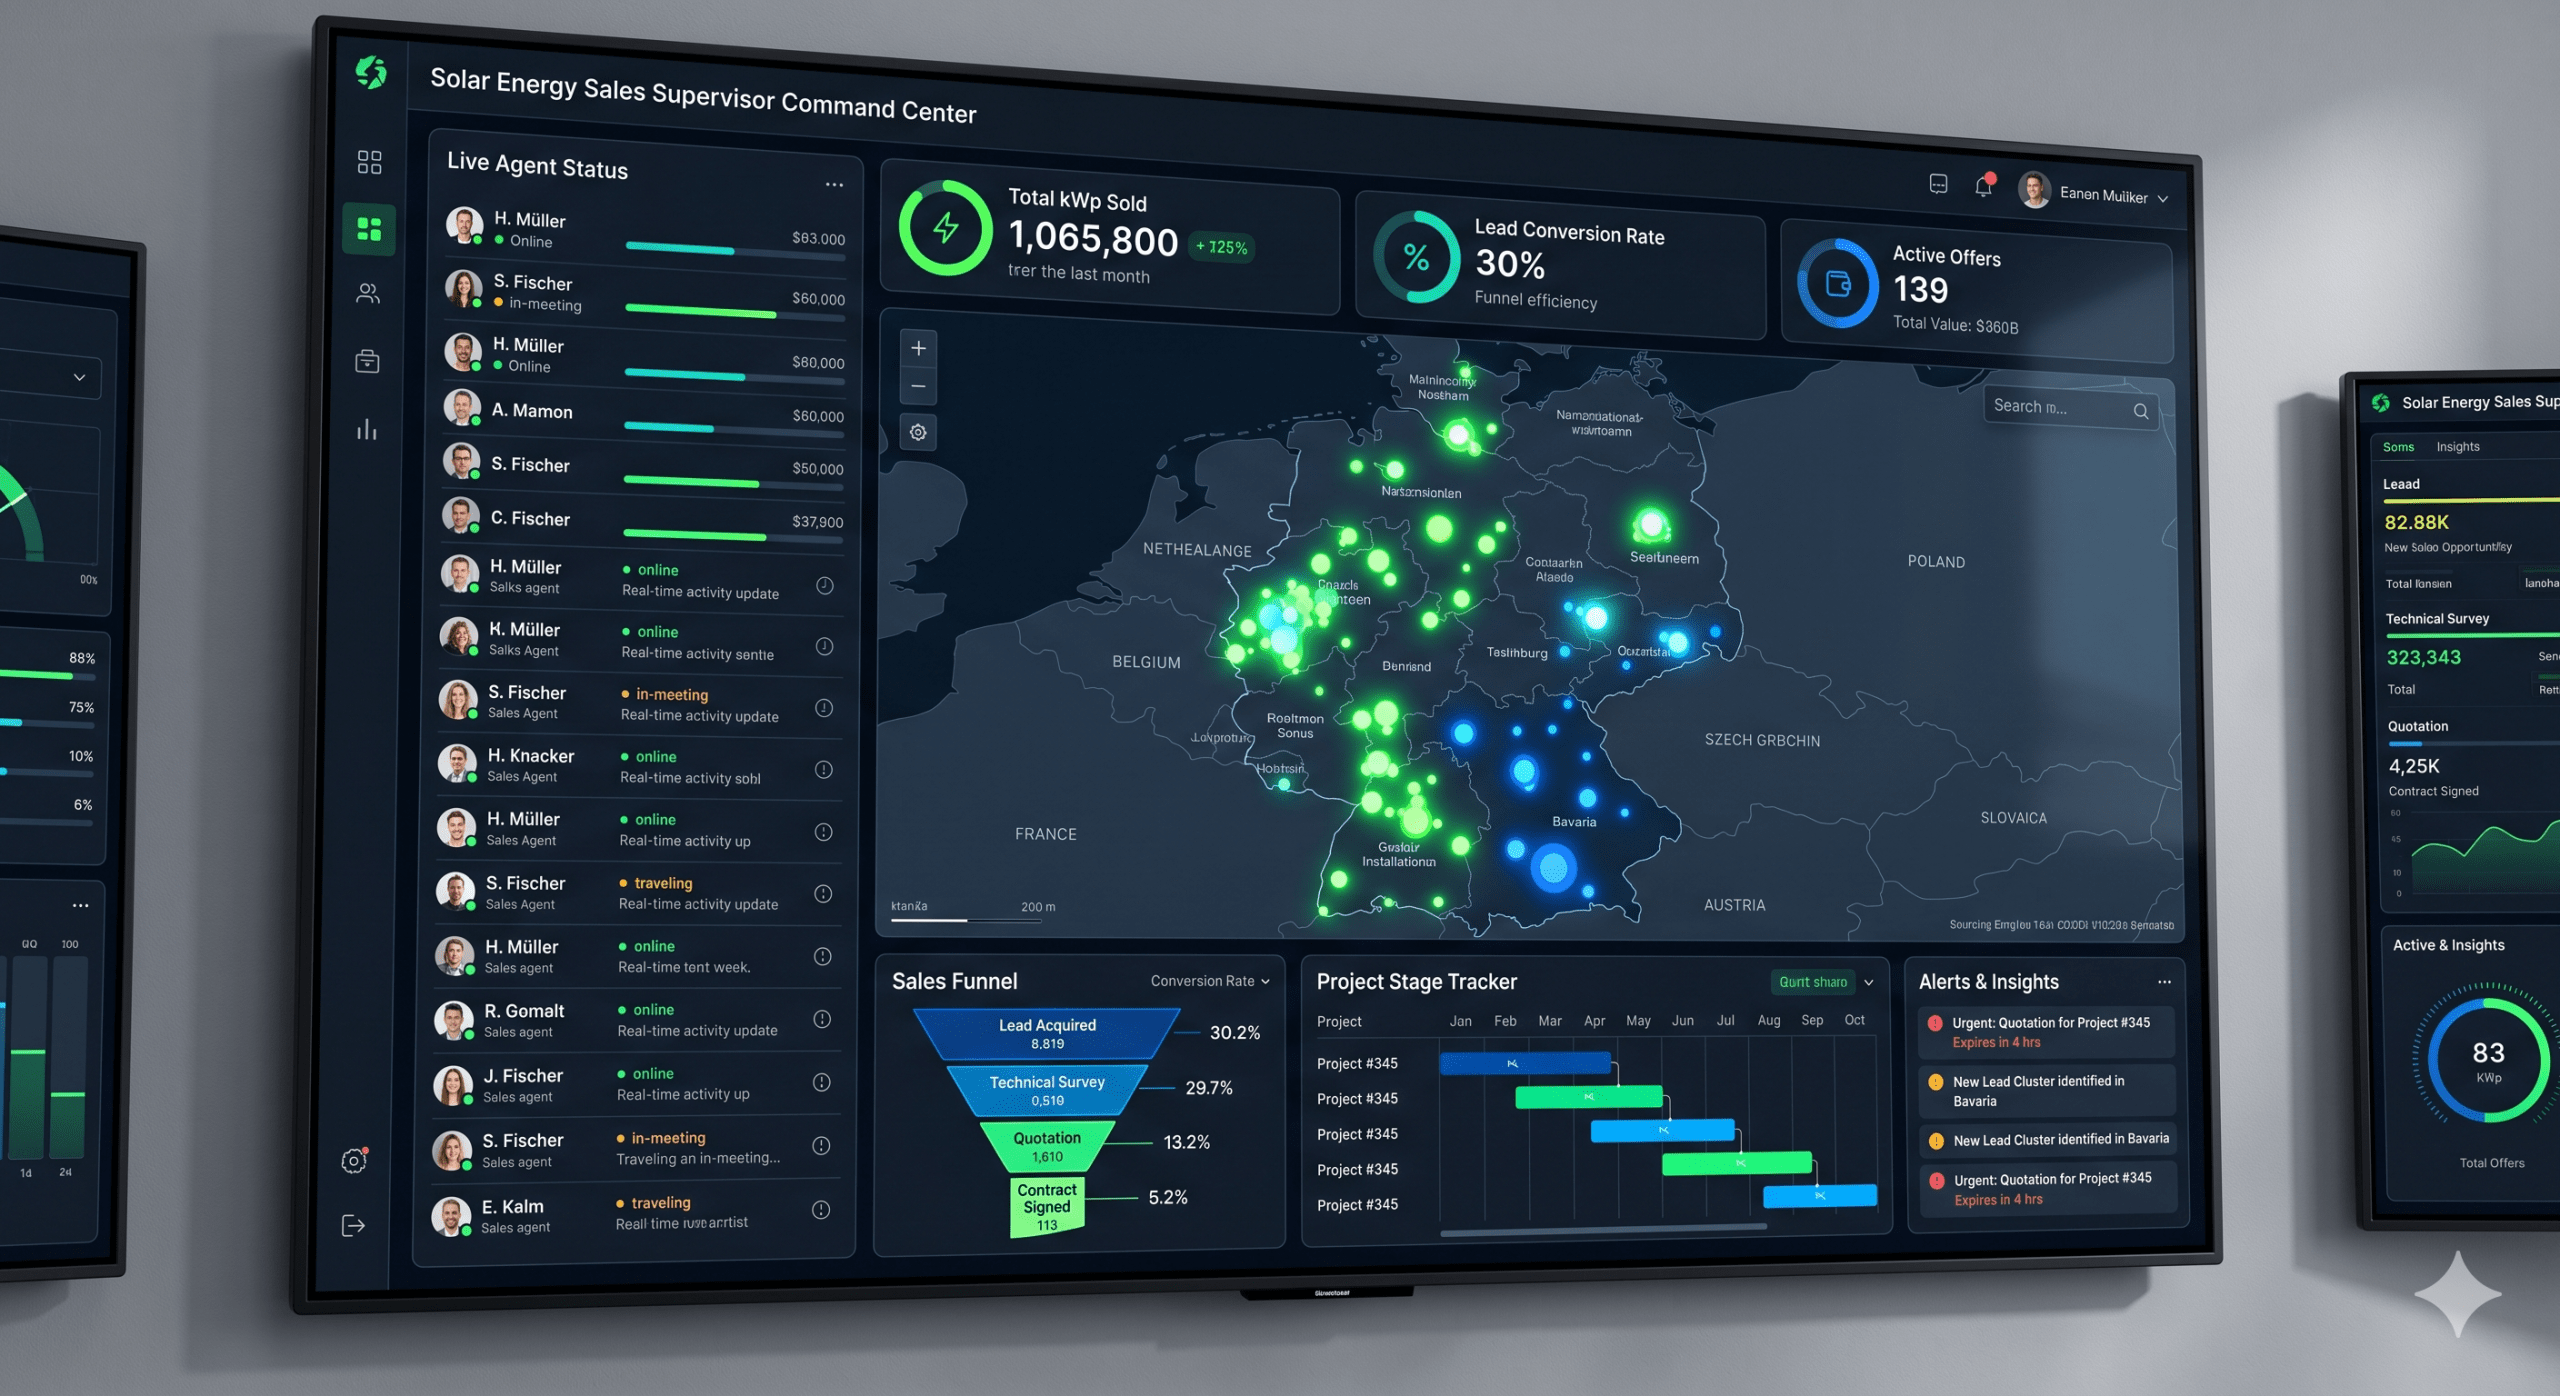
And now: a screenshot of an HTML one-pager after a couple of iterations and an adjusted color palette, with OpenStreetMap embedded and proper locations tagged:
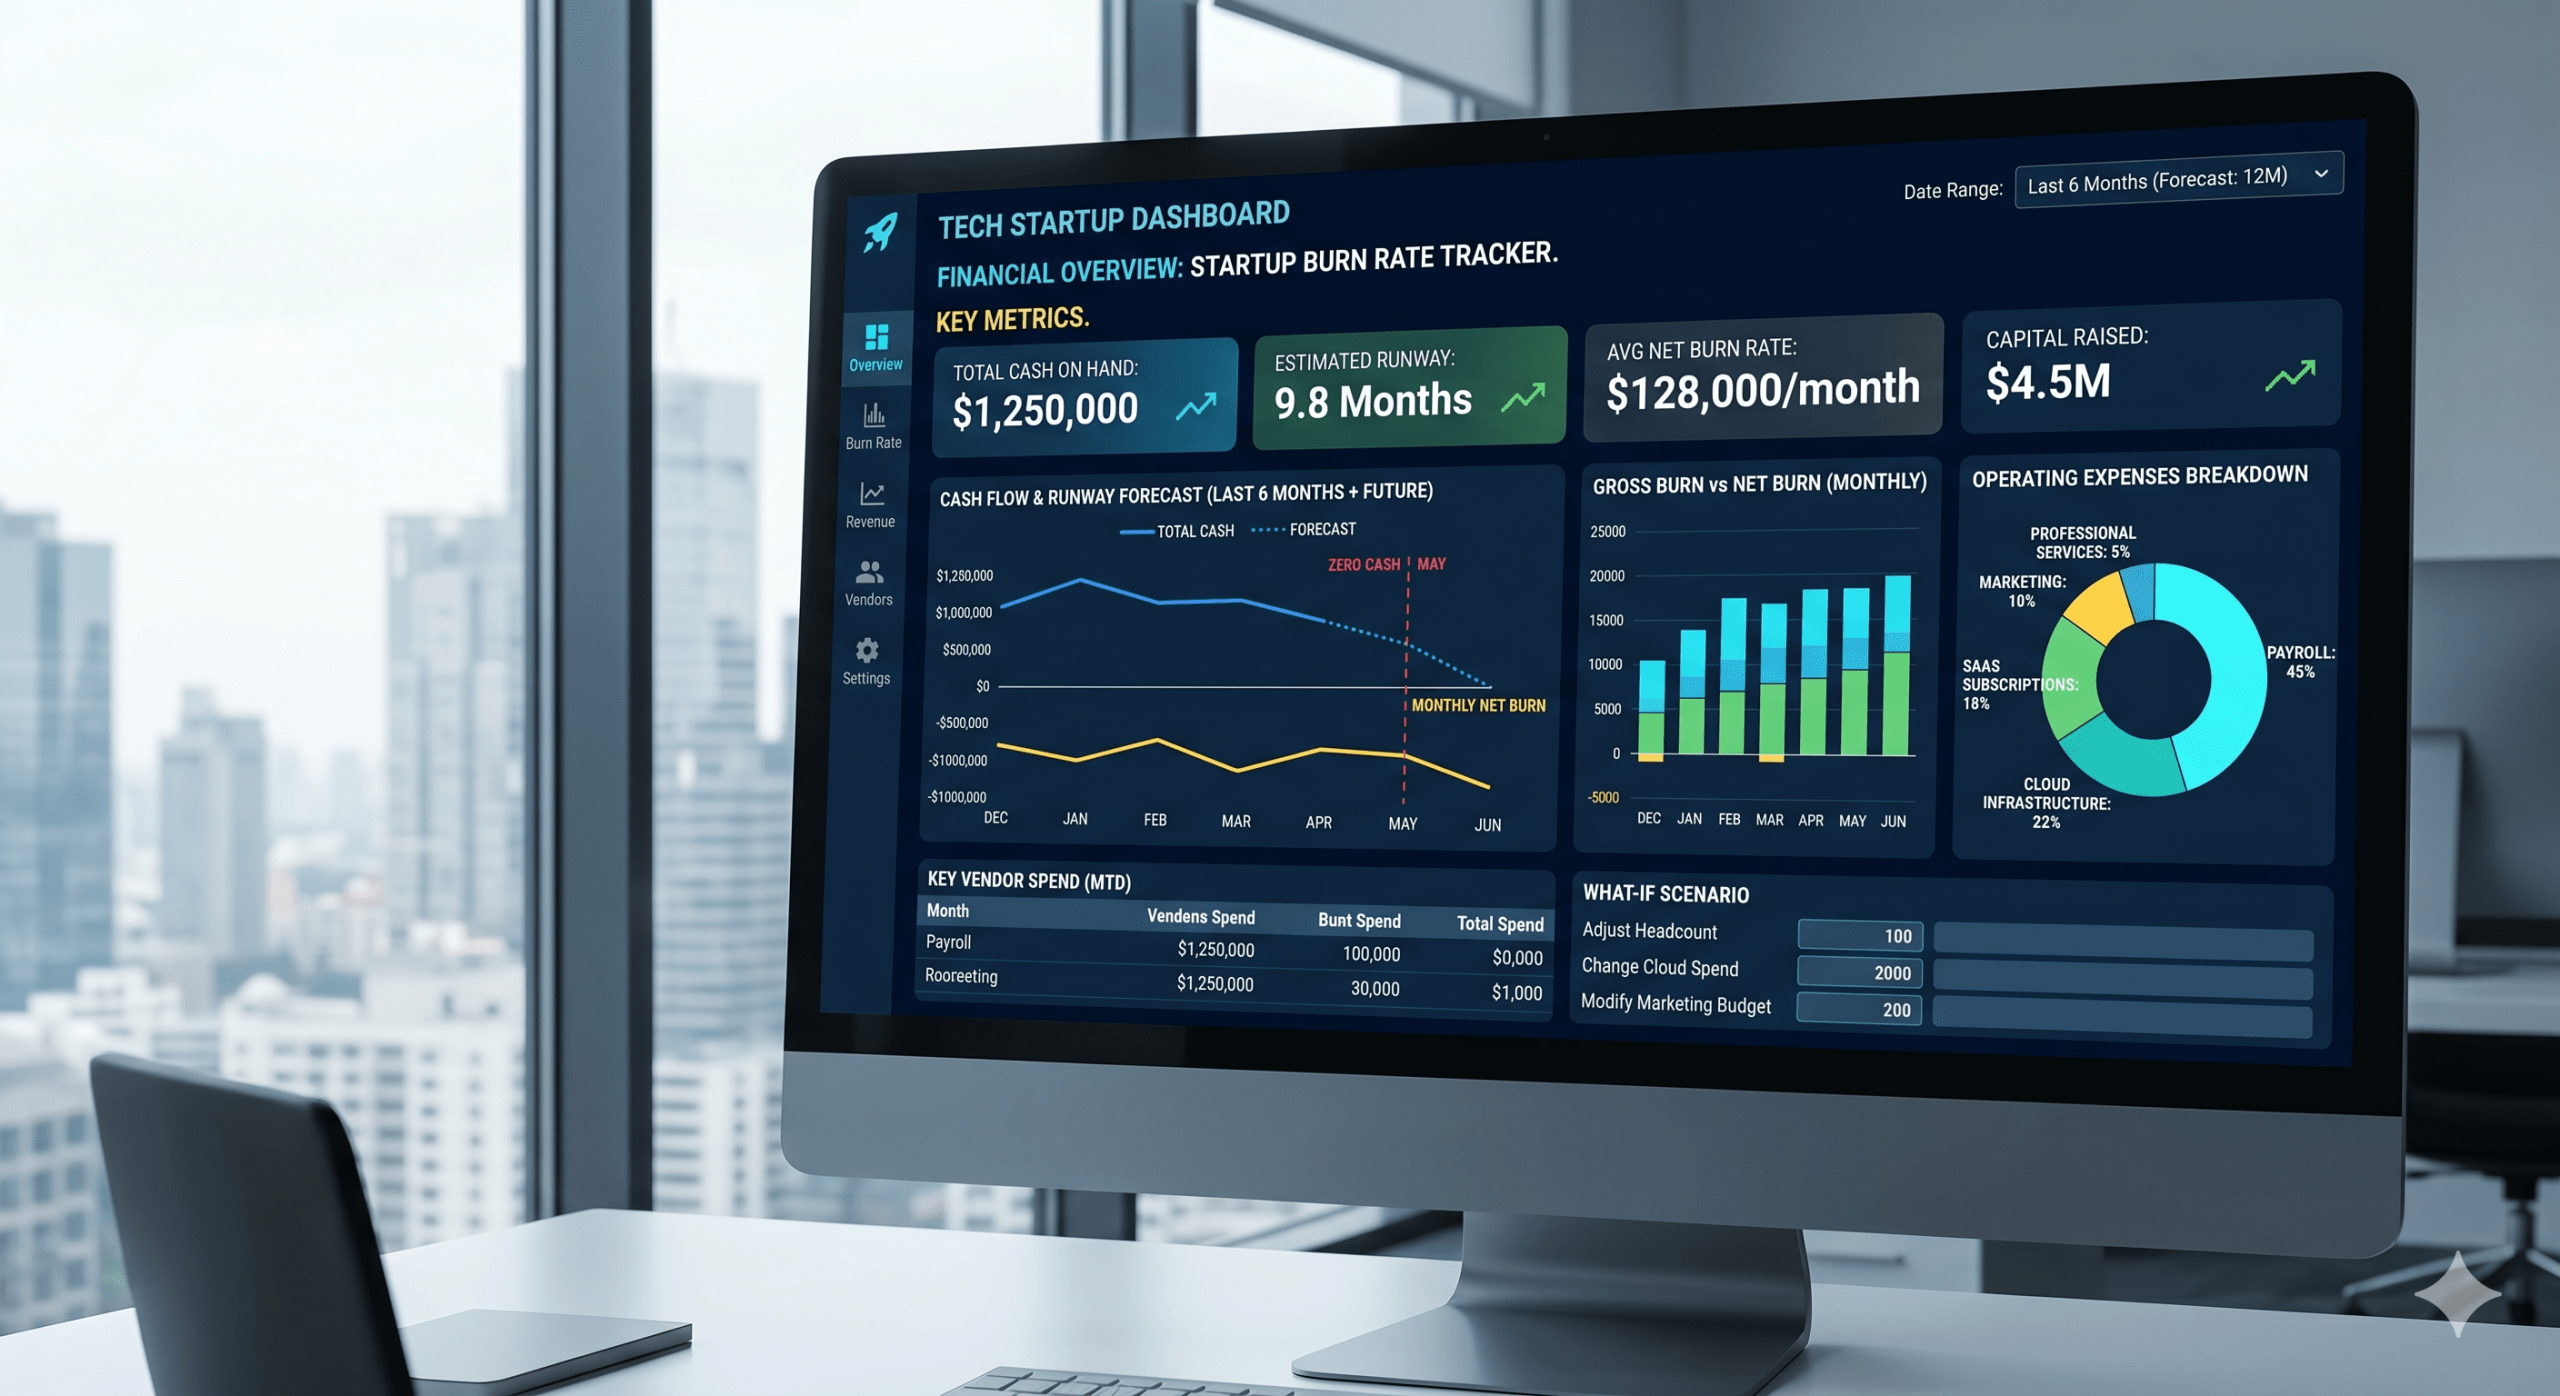
- A financial overview dashboard tailored for a tech startup’s burn rate.
A Gemini-generated image:
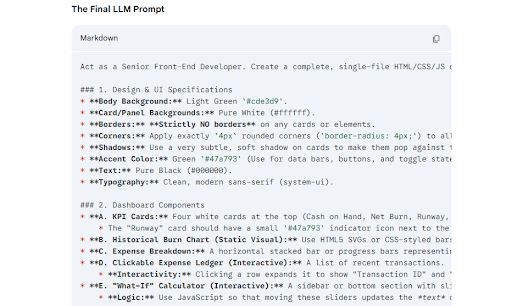
An example of a more detailed prompt generated by an LLM (maybe also in a collapsible element instead of an image):
And a screen recording of the interactive HTML render:
An interactive catalogue of competitor media across multiple marketing channels for a cosmetics team.
A Gemini-render:

This example required a little bit more input, with all image URLs collected manually.
A screen recording of the final HTML one-pager with some additional input (real image URLs from websites and social media):
Final Thought: The Speed of Design
As a final note on how fast this field is moving: while writing this post, Anthropic released Claude Design. This is a dedicated tool within Anthropic Labs specifically for turning ideas into high-fidelity UI prototypes.
It reinforces our core belief: the technical barrier to showing an idea is disappearing. For the modern BI consultant or analyst, the value is shifting away from the manual labor of building mock-ups and toward the expertise of knowing exactly what those mock-ups should show to solve a business problem.