Do you know which reports will show the essential information about the performance of your website? Or which reports will help you improve your sales? Perhaps, you are also wondering which dashboard will suit your daily needs in monitoring your marketing KPIs, aren’t you?
We’ve got something new for you: a report gallery!!!
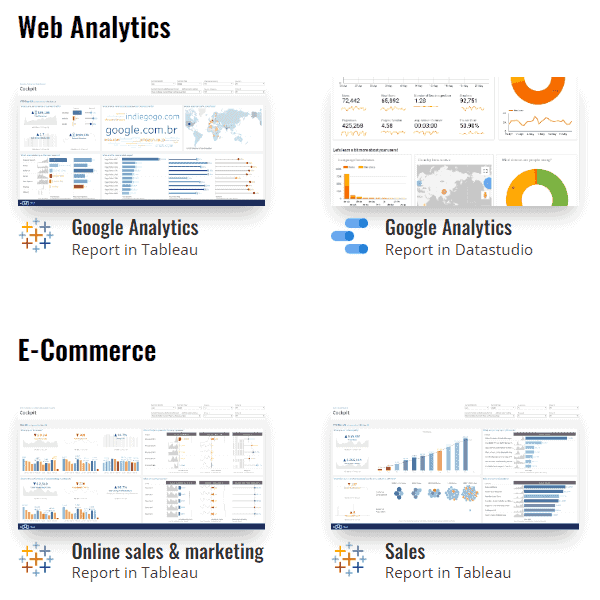
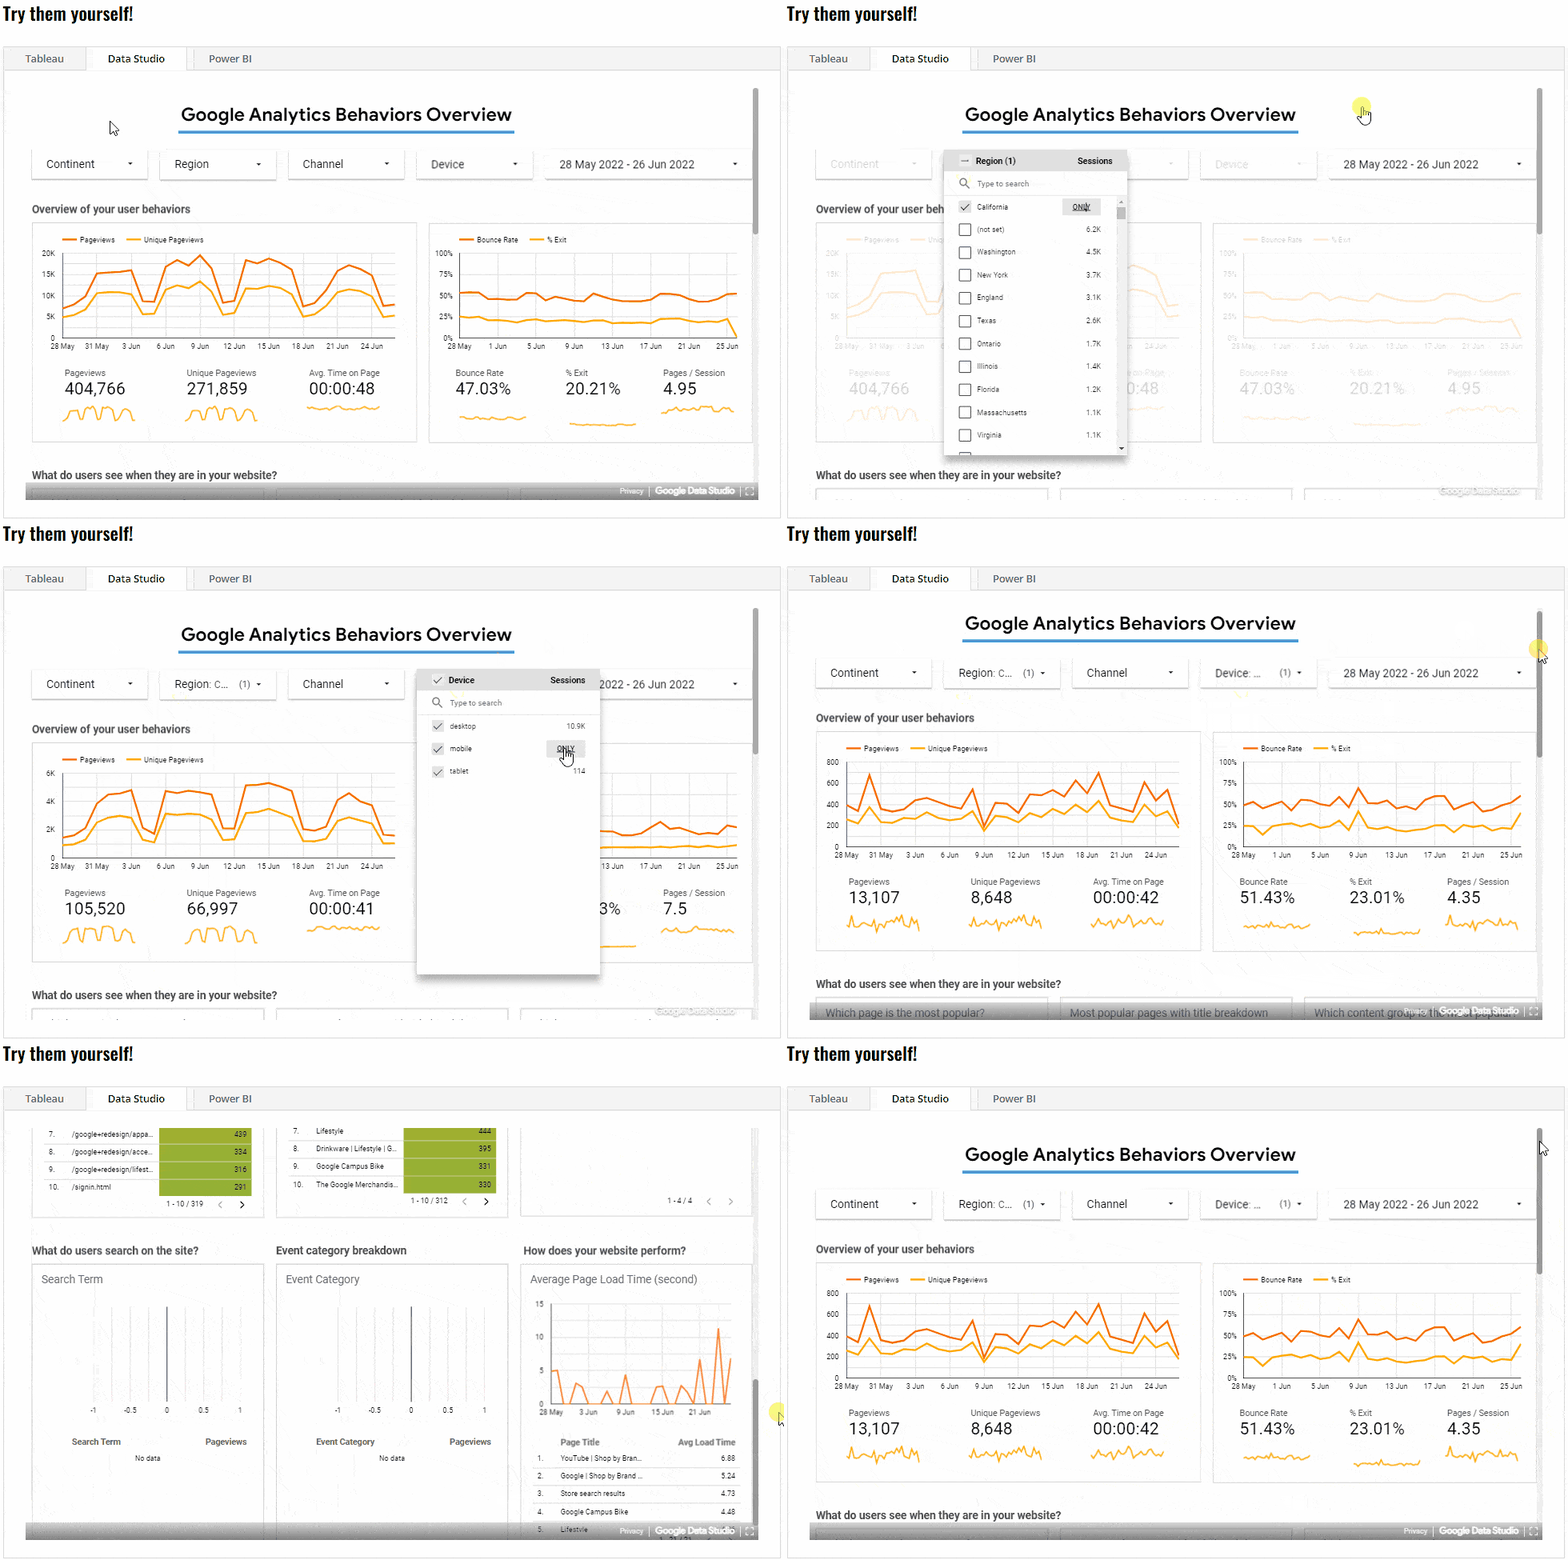
You can find different types of reports, take a look at a quick comparison of reporting tools and even see several live dashboards with charts, tables, filters and other interactive elements.
If you are eager to rush and check everything yourself, click here.
Or, if you want a little bit of intro please stay with me.

We know that different businesses and different teams require different reports in order to monitor important metrics and KPIs. While in most of the cases each company requires custom reports, web-analytics tools like Google Analytics or Adobe Analytics have taught us that there are a lot of standard metrics that can be visualized in standard reports and dashboards.
That is why we have selected several best practice reports for different use cases:
- Web Analytics
- Sales and E-commerce
- Marketing
- Market research
These reports are available as image previews and are aimed at providing you with a basic understanding of how different reports can look like in different tools and what elements can be included in a report or a dashboard.
If you already have some knowledge about the reporting tools, you may also know that for each tool one can find a good number of templates provided by the community (that’s also the reason why we included most of the reports as images).

Speaking about the tools: in the new report gallery page we are also showing you a brief comparison of the three main tools we are using for BI, reporting and visualization: Microsoft Power BI, Tableau and Google Data Studio.
And what is more important – we’ve embedded a sample report from each tool in one page and you can test each of them yourself!Isn’t that great?!
For the best experience please be sure to test these reports on your desktop


