With this one I would like to shed some light on the newly released Google Tag Manager Preview & Debug mode, which gives us a whole new experience when previewing our tracking setups. I am going to cut through the chase here and show you the most prominent enhancements that I personally find extremely useful
Note: GTM Debugger is now called Tag Assistant, don’t confuse it with Tag Assistant Chrome Extension, even though they are closely related (read on to understand how)
What will we do?
- Unlock the full feature set of Tag Assistant
- Core New Features of GTM Tag Assistant
- What do you need to change in your GA Setup
One thing to do before you start debugging
Now before I go into the details and you guys start experimenting with the new features, there is one point I would highly recommend you to do. The new GTM Tag Assistant works well as a standalone web application, however you can uncover a great set of handy features if you combine it with the Tag Assistant Chrome Extension.
There is nothing you need to do configuration-wise – just install the Tag Assistant Chrome Extension in your browser, that’s it. The new Debugger will realize that during your next debugging session and the extended features will be unlocked.
Core Features
Now let’s look at what has actually changed. While other providers have been trying hard to put on a decent challenge for the “old” GTM debugger, the team behind Google Tag Manager surprised everybody with much more advanced version of it.
Below are the new core features that I (personally) find dazzling:
The new GTM Preview Mode (Tag Assistant) is displayed in an own window
When you hit the Preview button in your container, you are now redirected to a separate web application under tagassistant.google.com, where you need to input the URL, where you would like to start the debugging.
You can also choose to include the debug signal in the URL, which has something to do with the Tag Assistant start-up functionality. By default it is recommended to include it, however for some sites, presumably Single-Page-Applications, this feature might not work. Just go ahead and turn it off in this case.
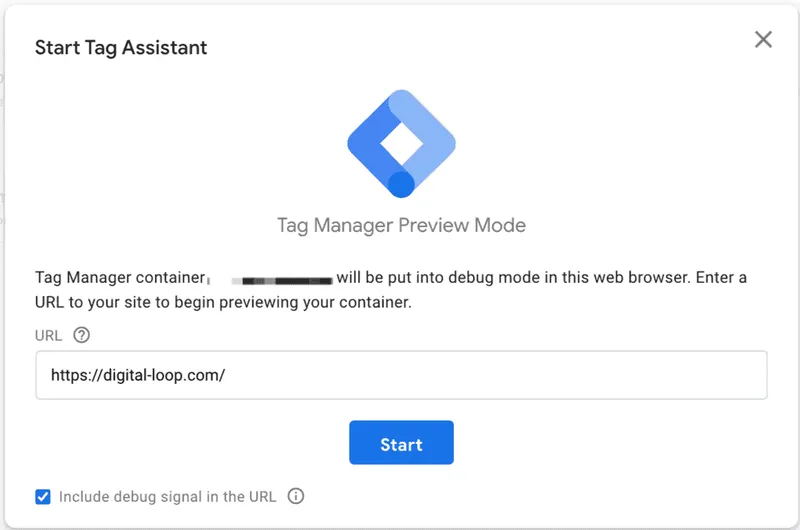
Hit the start button now, and you will have 2 tabs open: one with the New Debugger interface and the other one with the URL that you have specified
- Completely new interface of the Debugging Pane
As I mentioned before, after hitting the start button you will see a completely new Debugging Pane, which is now open in a new window instead of an iframe at the bottom of the web page. Let’s now run through some core features of the interface:
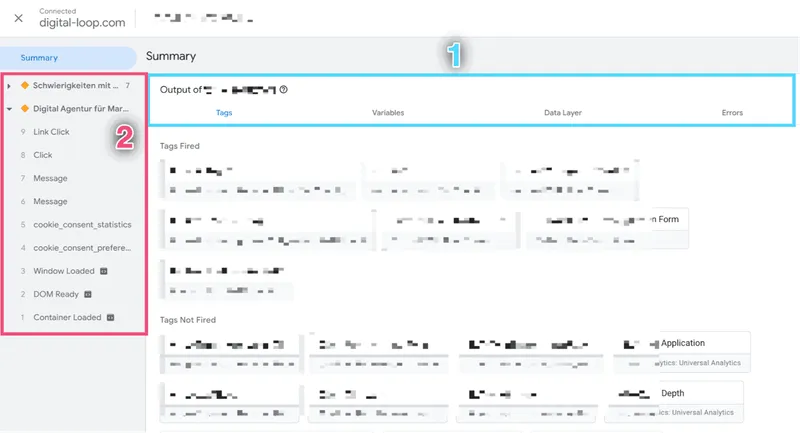
As Point 1 we can see the tabs, where we can navigate between Tags, Variables, Data Layer entries and Errors that happened at the level of any Data Layer event from the Event Stream.
Point 2 is the event stream itself, that shows us what events are fired to the Data Layer, when a page is loading or when we perform certain actions (e.g. clicks, scrolls, from submissions etc.). The event stream is clustered under Pageviews, that can be collapsed or expanded.
- A big one – Data Layer entries are not wiped when navigating to another page
That’s one of the handiest improvements, to my mind. Data Layer events stay in the Tag Assistant even if we navigate away. This gives us an opportunity to easily debug Tags and Events that are dispatched right before we unload the tab or go to another page.
Also, if you have the Tag Assistant Chrome Extension installed, the Debugger will let you easily differentiate between different tabs if you open a link in the new window. It does that by using colored shapes as visual identifiers. In the screenshot above I started off with the Pageview 1, that has a yellow rhomb as a visual identifier. Then I opened a link in the new tab, and the identifier for Pageview 2 changed to a blue square
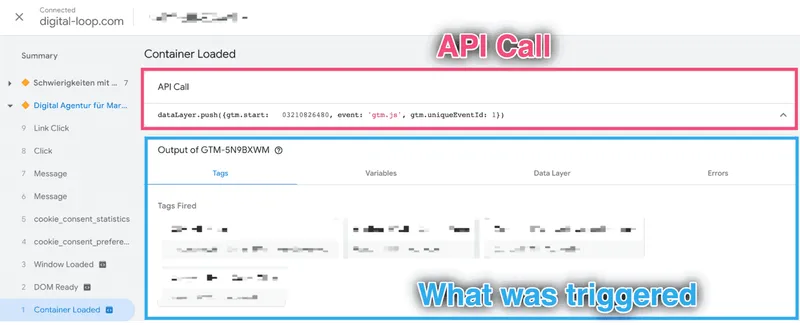
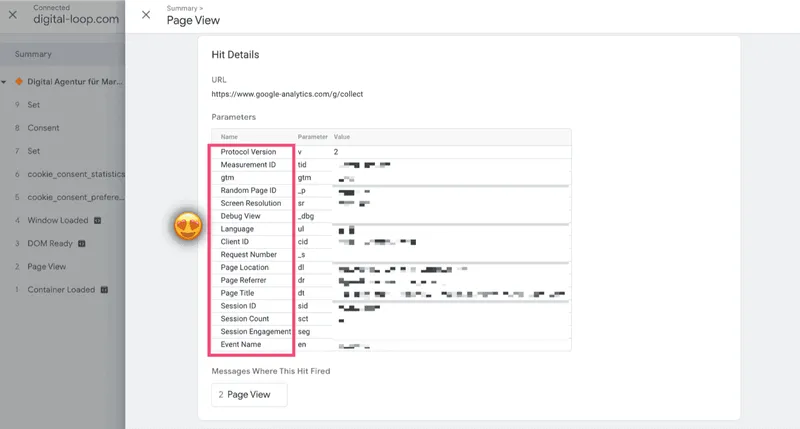
- Tag Assistant shows all API calls for gtag.js and dataLayer
You can view an individual API call by selecting an Event from the Event stream. You are then able to see the actual API call, including all the Output information (i.e. Tags, Variables, Errors etc.) triggered by that API Call.
- Tag Assistant is activated using 1st party cookie and localStorage
This is a huge plus, considering that Data Privacy policies are actively driving 3rd party cookies towards the sunset. Actually, Tag Assistant is using several checks to activate the Debugging Console, one of them is the referrer, that needs to be set to https://tagassistant.google.com.
Important: Therefore, don’t forget to add tagassistant.google.com to your Google Analytics referral exclusion list in order to prevent Tag Assistant from starting a new session
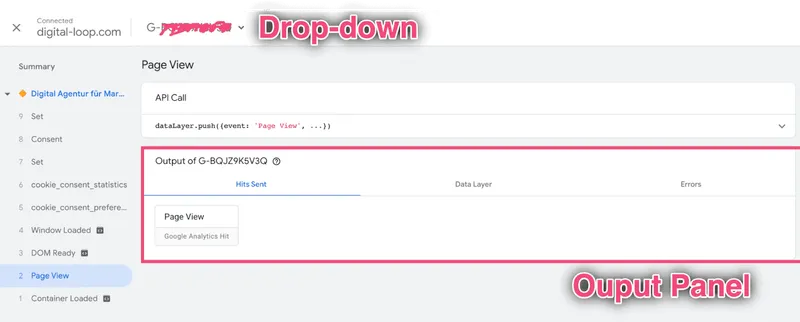
- Different containers for debugging gtag and dataLayer APIs (very useful when you are using Google Analytics Web + App / Google Analytics 4)
You can select a container from the drop-down menu at the top of your Tag Assistant. When you select a container that is debugging your Google Analytics 4 implementation, Tag Assistant’s interface will slightly change. It will now let you see Hits, Data Layer messages and Errors.
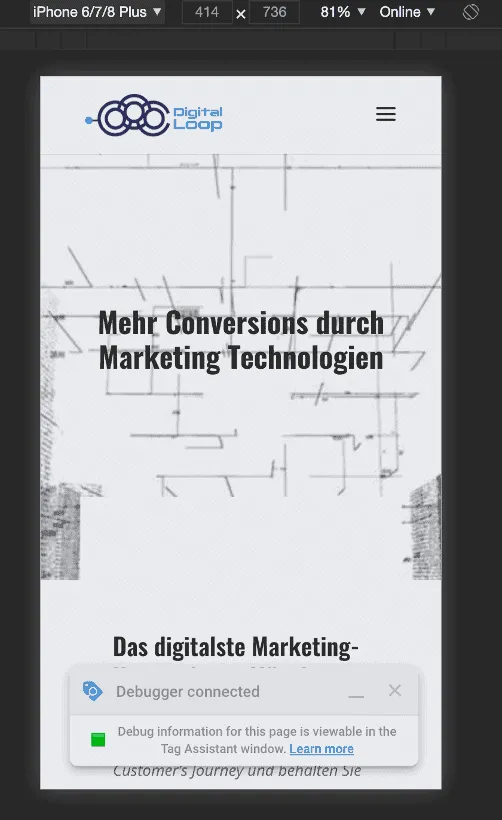
- Debug mobile implementations easily
When you use the new Debugger together with the Tag Assistant Chrome Extension, the Debugger is open in a new browser tab, which allows us to run mobile emulations and conveniently debug our tracking setups. If you have never debugged mobile before – trust me, this feature turns it into a piece of cake
Summary
This new release of GTM Preview & Debug Mode contains many features that I wondered about for a long period of time. This is great news for both new and advanced GTM users and it will definitely make your life easier, especially if you have complex analytics setups. Since the Tag Assistant is still packaged as BETA, I’m excited to see what new features the GTM team will show us next…
Stay tuned!
Are you looking for an expert on Google Tag Manager? Simply click here.