REPORTING & DATA VISUALIZATION
The basis for a data-driven strategy: business & marketing analyses and dashboards
Today, with a variety of analysis tools and BI tools data analysis is everywhere. However, there are bundles of tools that bring tons of data on your table. Too much data but too little time to create reports and to get actionable insights? If you’re experiencing data overwhelm and want to obtain well-set BI reports and meaningful insights, stay calm — that’s where we can support you in reporting and data visualization.
Our references


Why Reporting & Data Visualization
Easy to Understand
Get clear dashboards and reports with understandable statements and meaningful summaries of your data.
Accelerate Action
Web Analytics Report or Marketing Dashboard? We help you to share results and related conclusions with your stakeholders more efficiently and easily..
Save time & Increase Productivity
Save more time for other tasks by setting up data integration and automating BI reports.
Our Services
BI Solution Scoping
BI Strategy Design
We develop a strategy for implementing a BI solution that meets your individual requirements.
BI Solution Scoping
According to your business objectives, we help you to evaluate and select an ideal solution.
BI Solution Setup
Whether Google Data Studio, Microsoft Power BI, Tableau or even Excel – we create a data pipeline for you and set up the BI environment with any BI tool of your choice.
Reporting & Data Visualization
Is your corporate growth slowing down? With custom dashboards, you can keep track of the numbers, never miss a market trend and stay competitive. Facilitate demand capture, planning and idea generation with management dashboards, online marketing dashboards, SEO dashboards, Google Analytics dashboards, KPI dashboards and more.

Trainings & Workshops
We provide on-site training of your team based on the best practices of Reporting & Data Visualization.
Our Satisfied Clients
Reports and dashboards with Tableau
Use Case: SEO Performance Dashboard
- An interactive dashboard with Google Search Console data, replicating the standard Performance report in GSC.
- GSC data was collected with SEO Data Platform and stored in Google Big Query.
- The solution was implemented to ensure that data from Google Search Console is available longer than the tandard 16-month range.
Use Case: E-Commerce Daily Sales Report
- A daily report of an e-commerce shop showing sales KPIs and top-performing goods across several channels: an own webshop, Amazon, eBay, and Kaufland.
- Data from different sources are stitched to a single MySQL database.
- Available on Tableau Server with a scheduled daily email delivery as PDF.
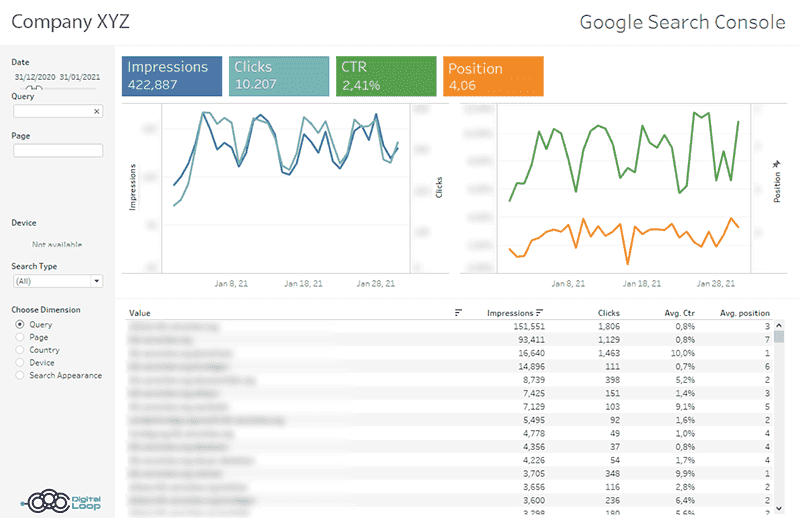
Tableau Example of Google Search Console Dashboard
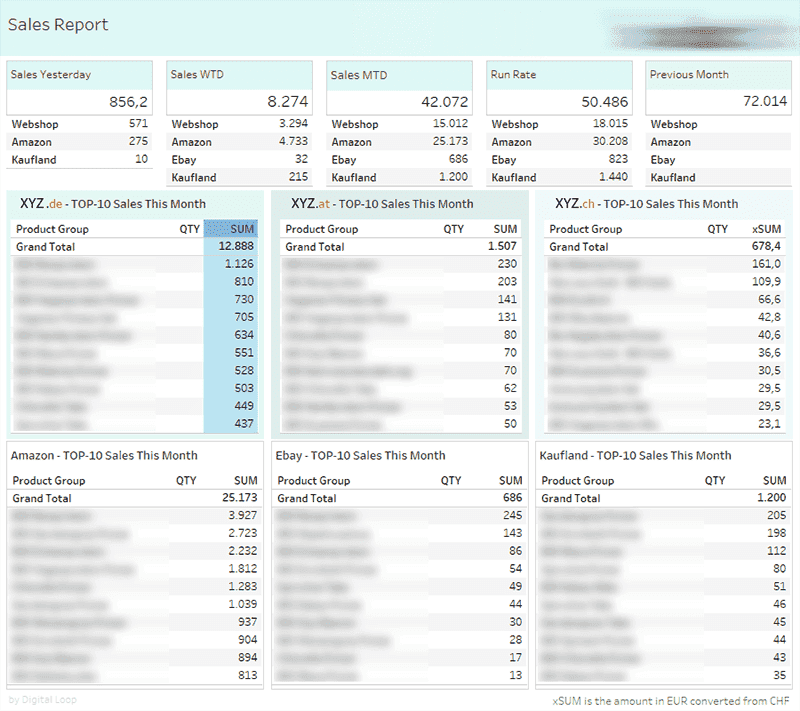
E-Commerce Daily Sales Report
Reports and dashboards with Google Data Studio
Use Case: Web Analytics Dashboard
- Customizable web-analytics report to monitor:Web User Behavior Overview (standard Google Analytics metrics)Lead Generation Performace (macro and micro conversions)Awareness Performance (channel acquisition and engagement)Organic search performance (SEO-relevant metrics)
- Web User Behavior Overview (standard Google Analytics metrics)
- Lead Generation Performace (macro and micro conversions)
- Awareness Performance (channel acquisition and engagement)
- Organic search performance (SEO-relevant metrics)
- Live connection to datasets with the latest data
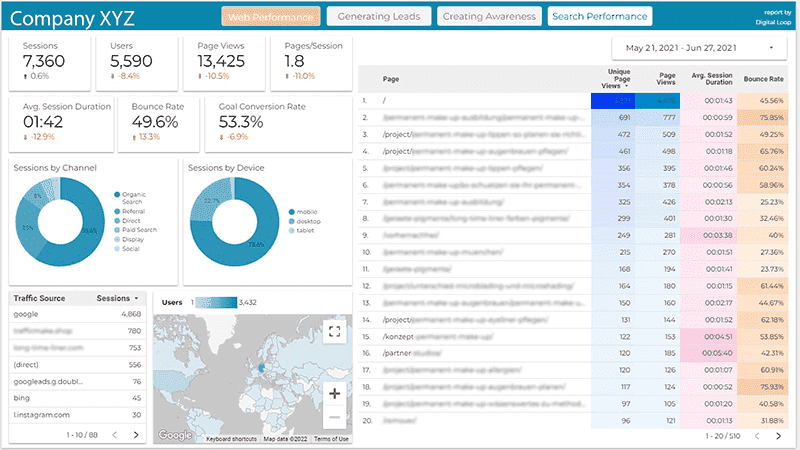
Image 1
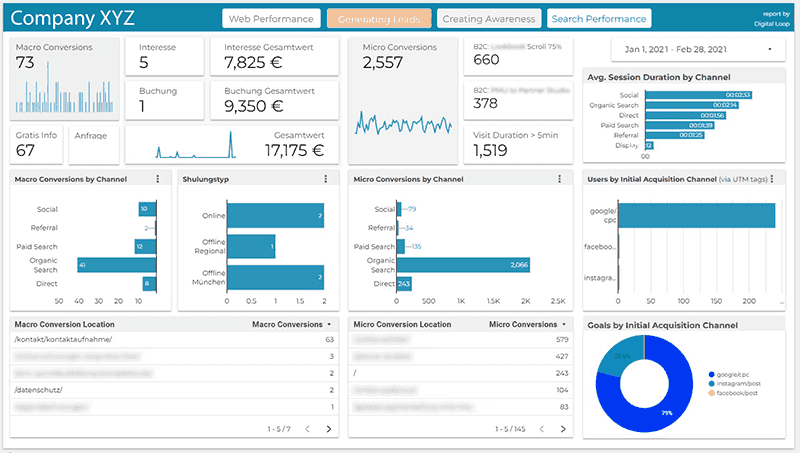
Image 2
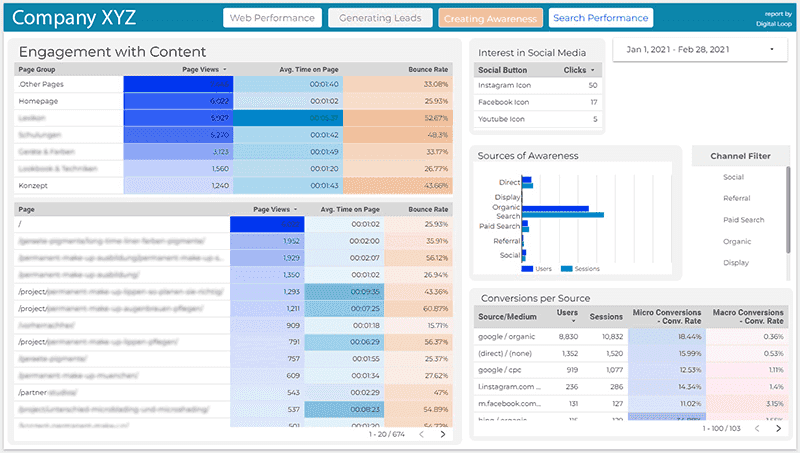
Image 3
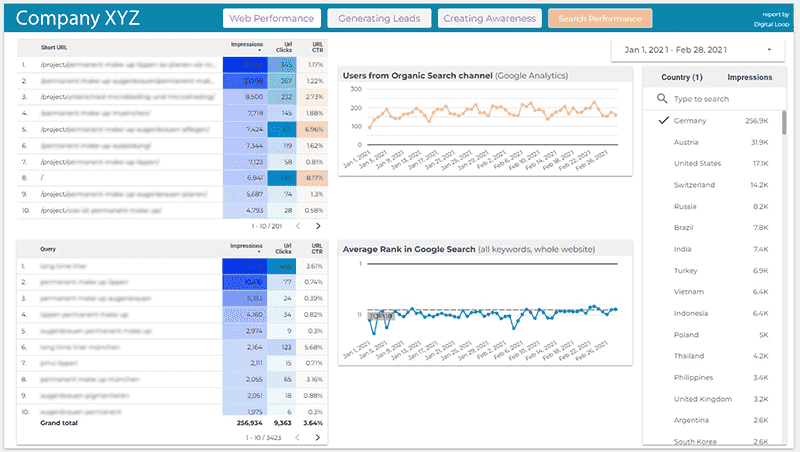
Image 4
Reports and dashboards with Microsoft Power BI
Use Case: E-Commerce Cross-Selling Analysis
- Basket analysis of an e-commerce shop with the goal to identify the best cross-selling items.
Use Case: Log file analysis
- Custom visualization of website crawl stats and a review of possible crawling issues.
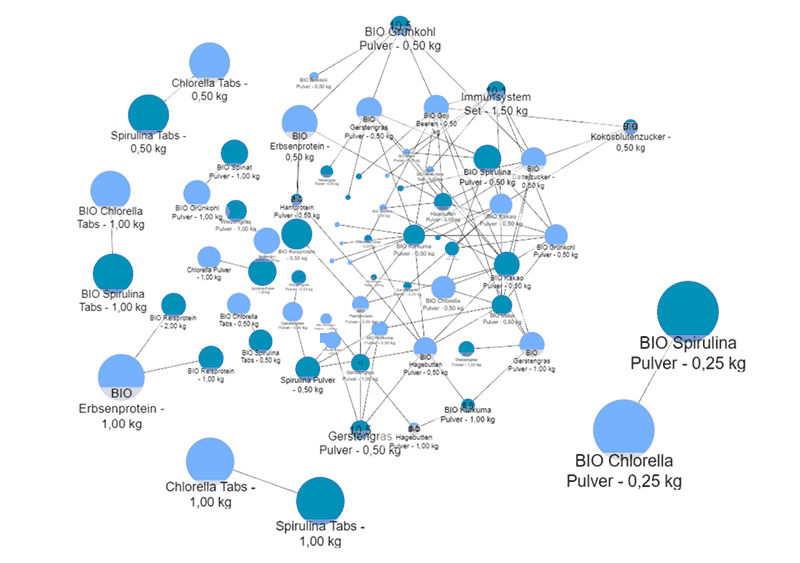
Image 1
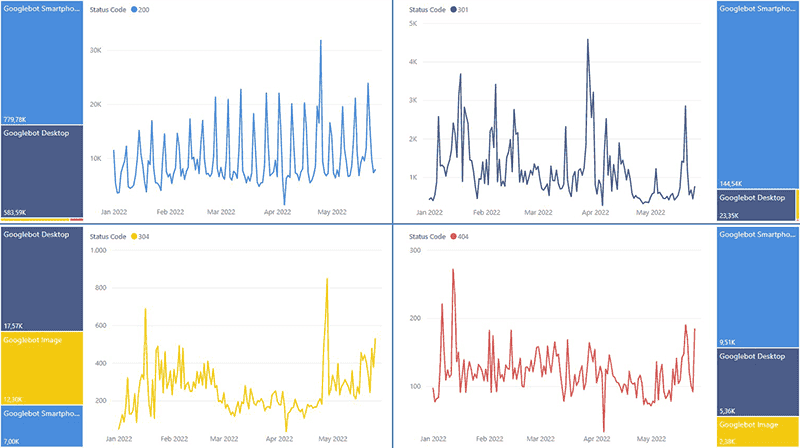
Image 2
Still not sure which report or tool suits best?
Check out our Report Gallery, where we collected several best practice reports for different teams and business needs!
Our ServicesRecommended Blog Posts

AI & Project Management: How AI Influences the Role of a PM Today and in the Future
Artificial Intelligence is reshaping many professions, and project management is no exception.
Read More
The Role of a Project Manager at Digital Loop
At Digital Loop, stepping into the role of a Project Manager means becoming a bridge between strategy and execution, as well as between people and purpose.
Read More
The Importance and Purpose of Project Management in Modern Organizations
In the contemporary digital and business landscapes, project management has become a cornerstone of operational success.
Read More
Meet your team of Reporting & Data Visualization

Yury Tolmadzhev
- 10+ years experience in BI, Data Analytics & Business Development
- Power BI & Excel Expert

John Munoz
- 10+ years experience in Digital Analytics, MarTech & Tech SEO
- Google Data Studio Expert

Vladimir Stashevskiy
- 10+ years experience in Digital Analytics, MarTech & Digital Marketing
- Google Data Studio Expert

Jhonatan Arcos
- 4+ years of experience in MarTech Engineering, BI & Tracking Development
- Expert in Tealium, Google Tag Manager and various DWH technologies
Frequently Asked Questions in Reporting & Data Visualization
What are the advantages of using interactive data visualisation?
Business vs. data analysis - what are the differences?
What is Ad hoc reporting?
What makes up a good data visualisation?
What are the differences between static and dynamic reporting?
Check other related topics we specialize in!
Contact Us
Via contact form, e-mail or callGet in touch with us
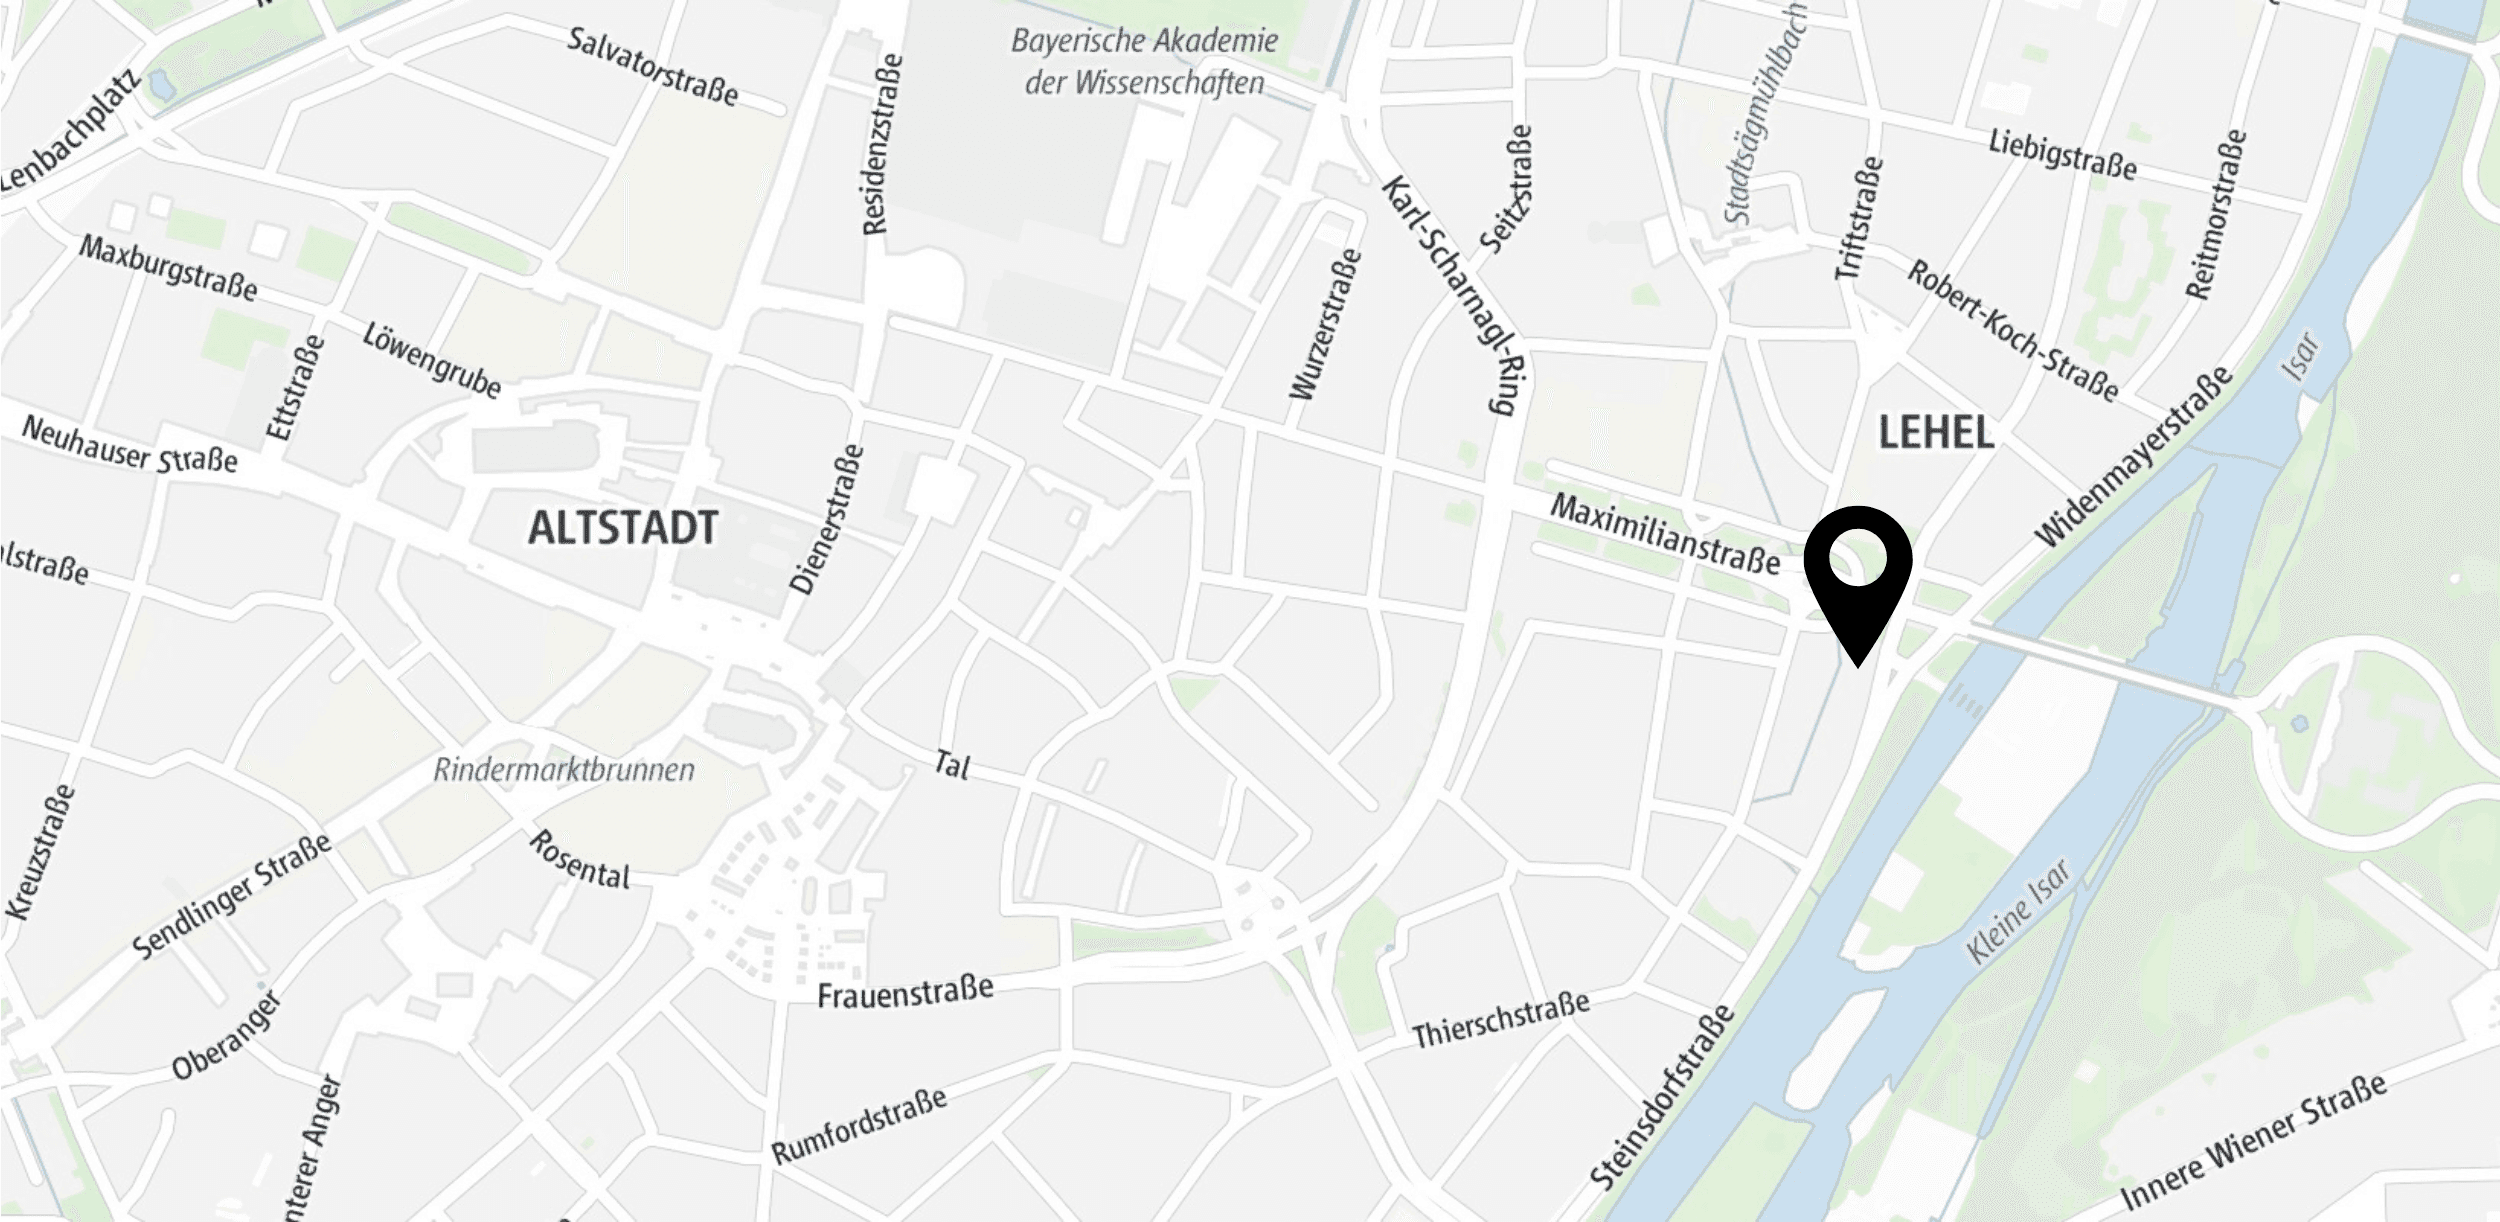
You can find our office in the heart of Munich:
We are social