Latest Posts about Digital Analytics & BI

THE CUSTOMER EXPERIENCE - A GUIDE TO CDP MARKETING
In recent years, the opportunities offered by digital transformation at a wide variety of levels hav ...
Read More
by John Munoz
GTM: SCALABLE CLICK TRACKING USING CUSTOM HTML ATTRIBUTES & DOM
How many times have we faced the challenge, when there are so many valuable clickable elements that ...
Read More
NEW GTM DEBUGGER EXPERIENCE A.K.A. TAG ASSISTANT
including something you definitely have to change in your GA Setup – read on! ...
Read MoreMICROSOFT POWER BI MAY UPDATE 2022
Latest news from Power BI: May update brings us field parameters, zoom and select improvements, new ...
Read More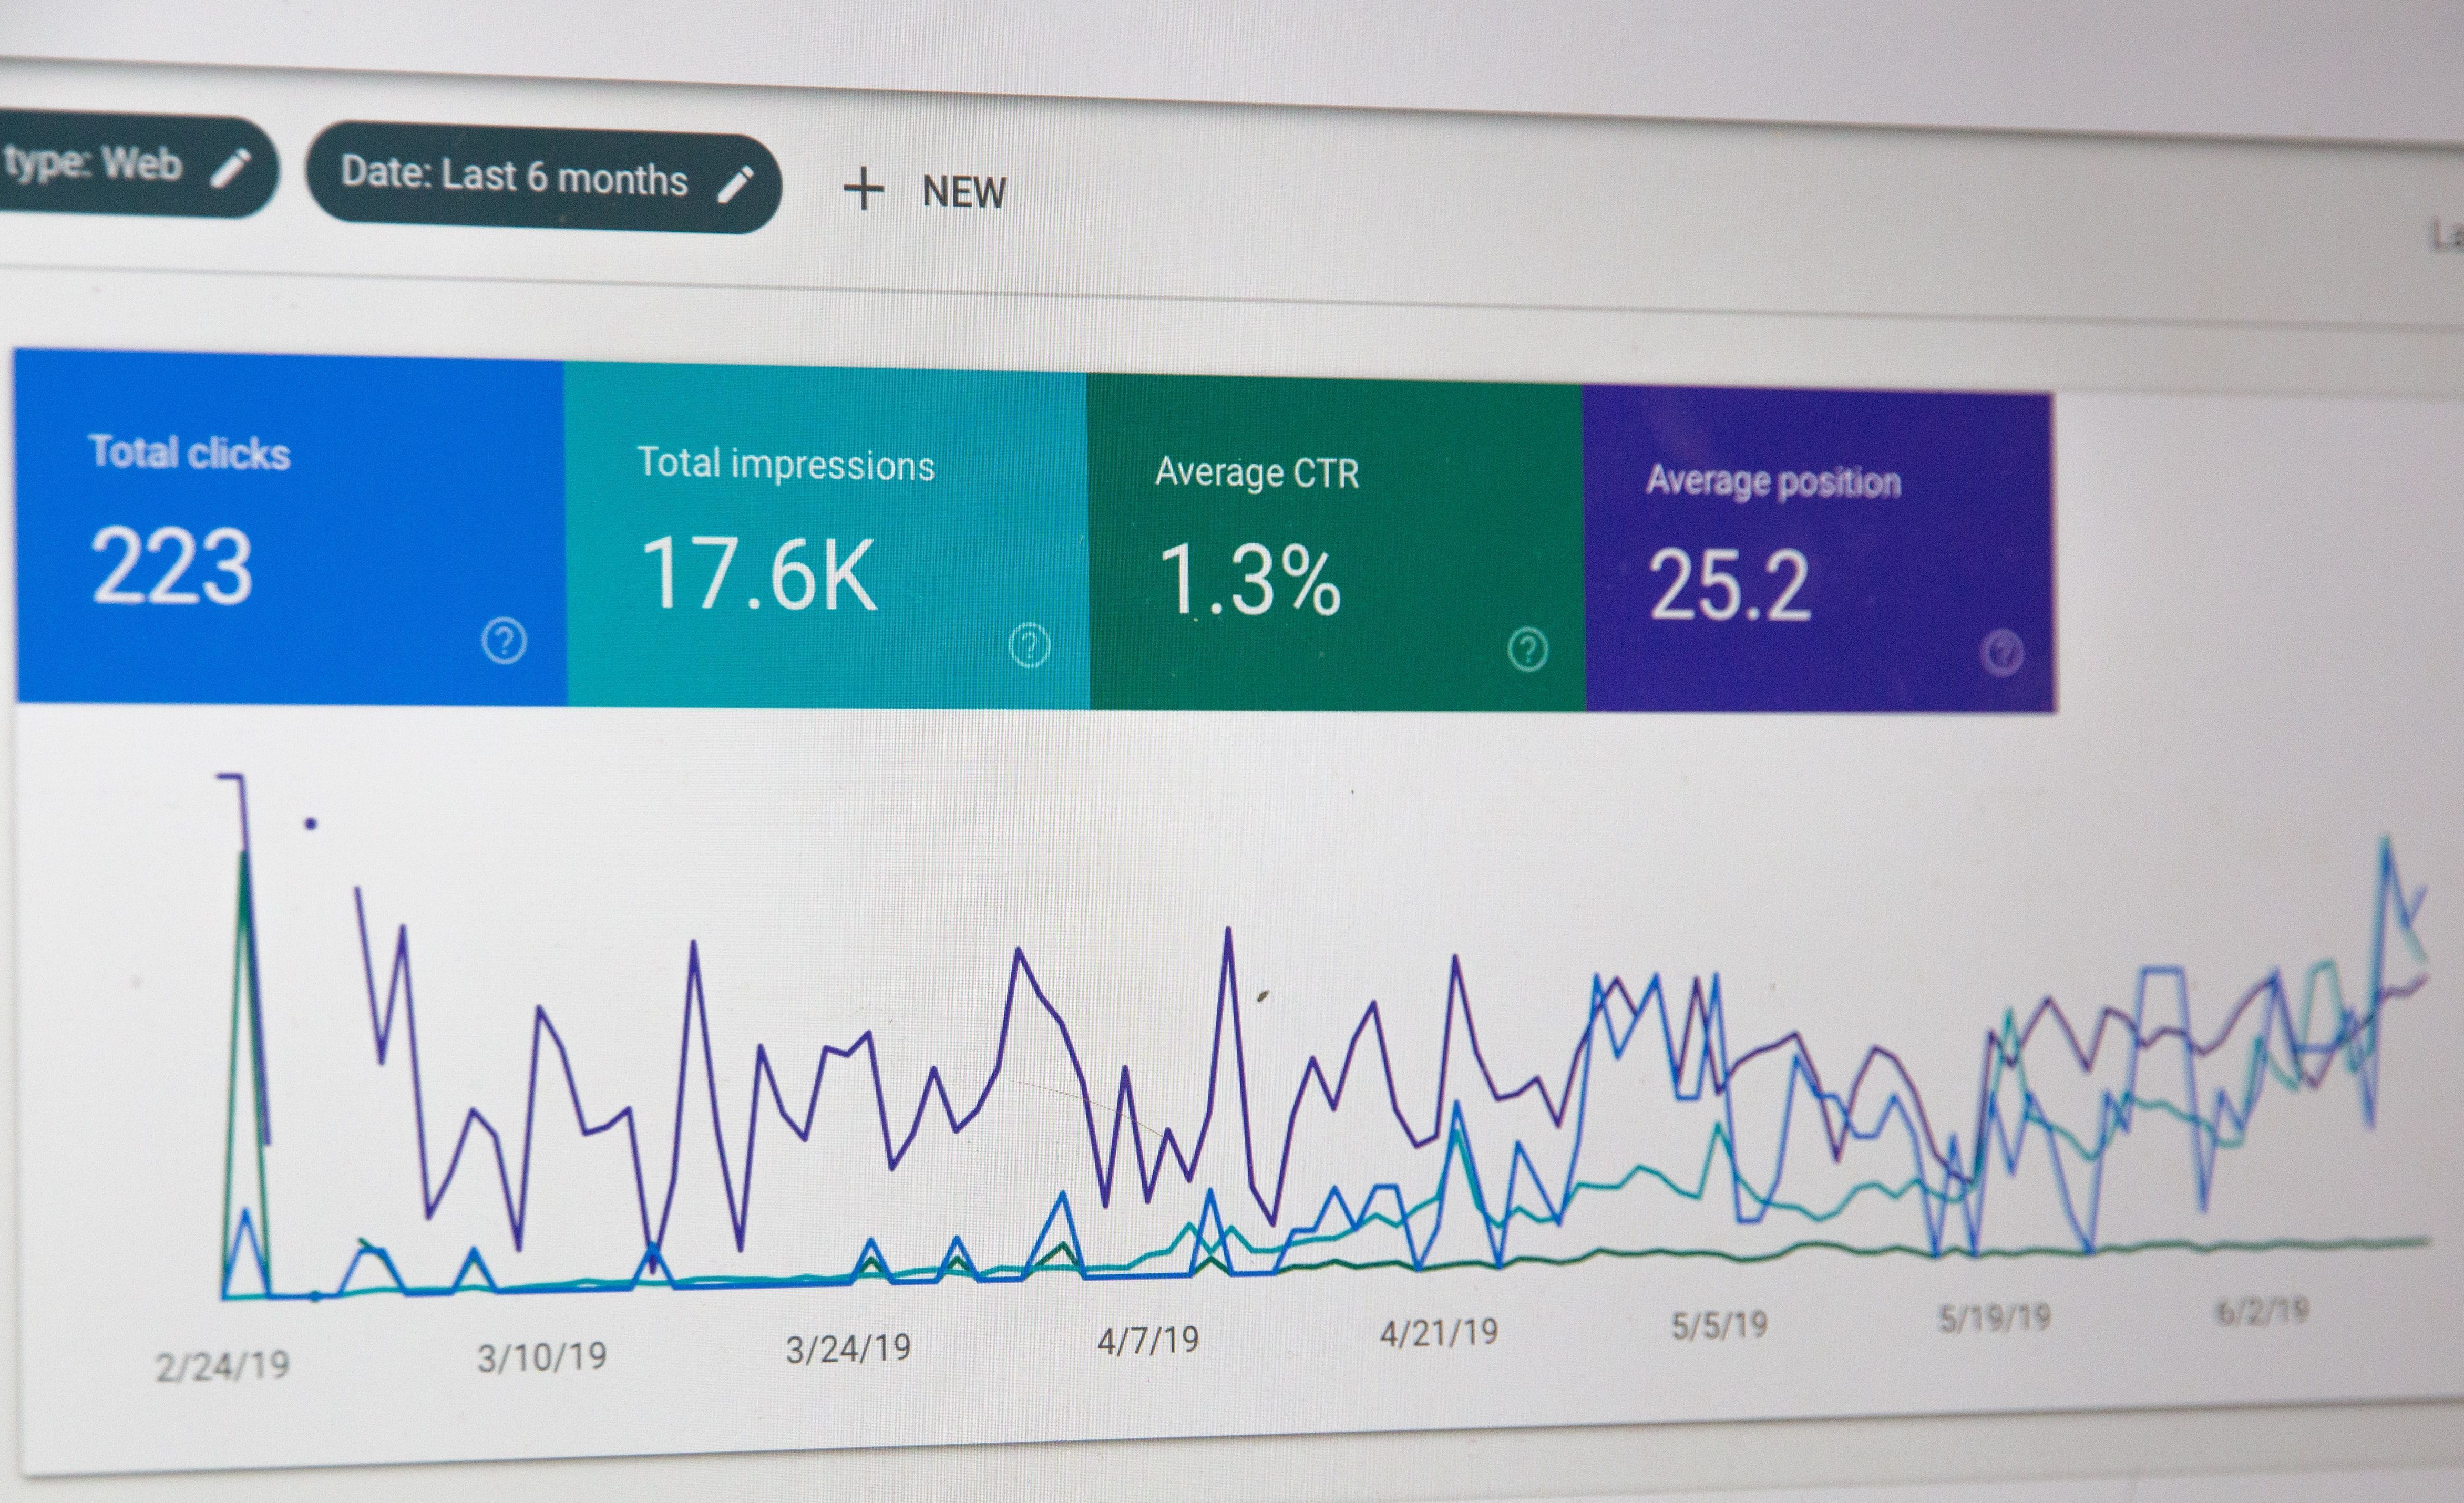
Unsure about the report? Discover our new report gallery!
We’ve got something new for you: a report gallery!!! ...
Read More

UNLEASH THE POWER OF “RIGHT-CLICK” IN ADOBE ANALYTICS #1
UPGRADE YOUR LINE CHART BY PERIOD COMPARISON & QUICK CALCULATION ...
Read More.42a855a1.png)
WHY MY ADOBE ANALYTICS CAMPAIGN TRACKING DOESN’T WORK?
Typical 5 mistakes that you can check out and avoid them for your campaign! ...
Read More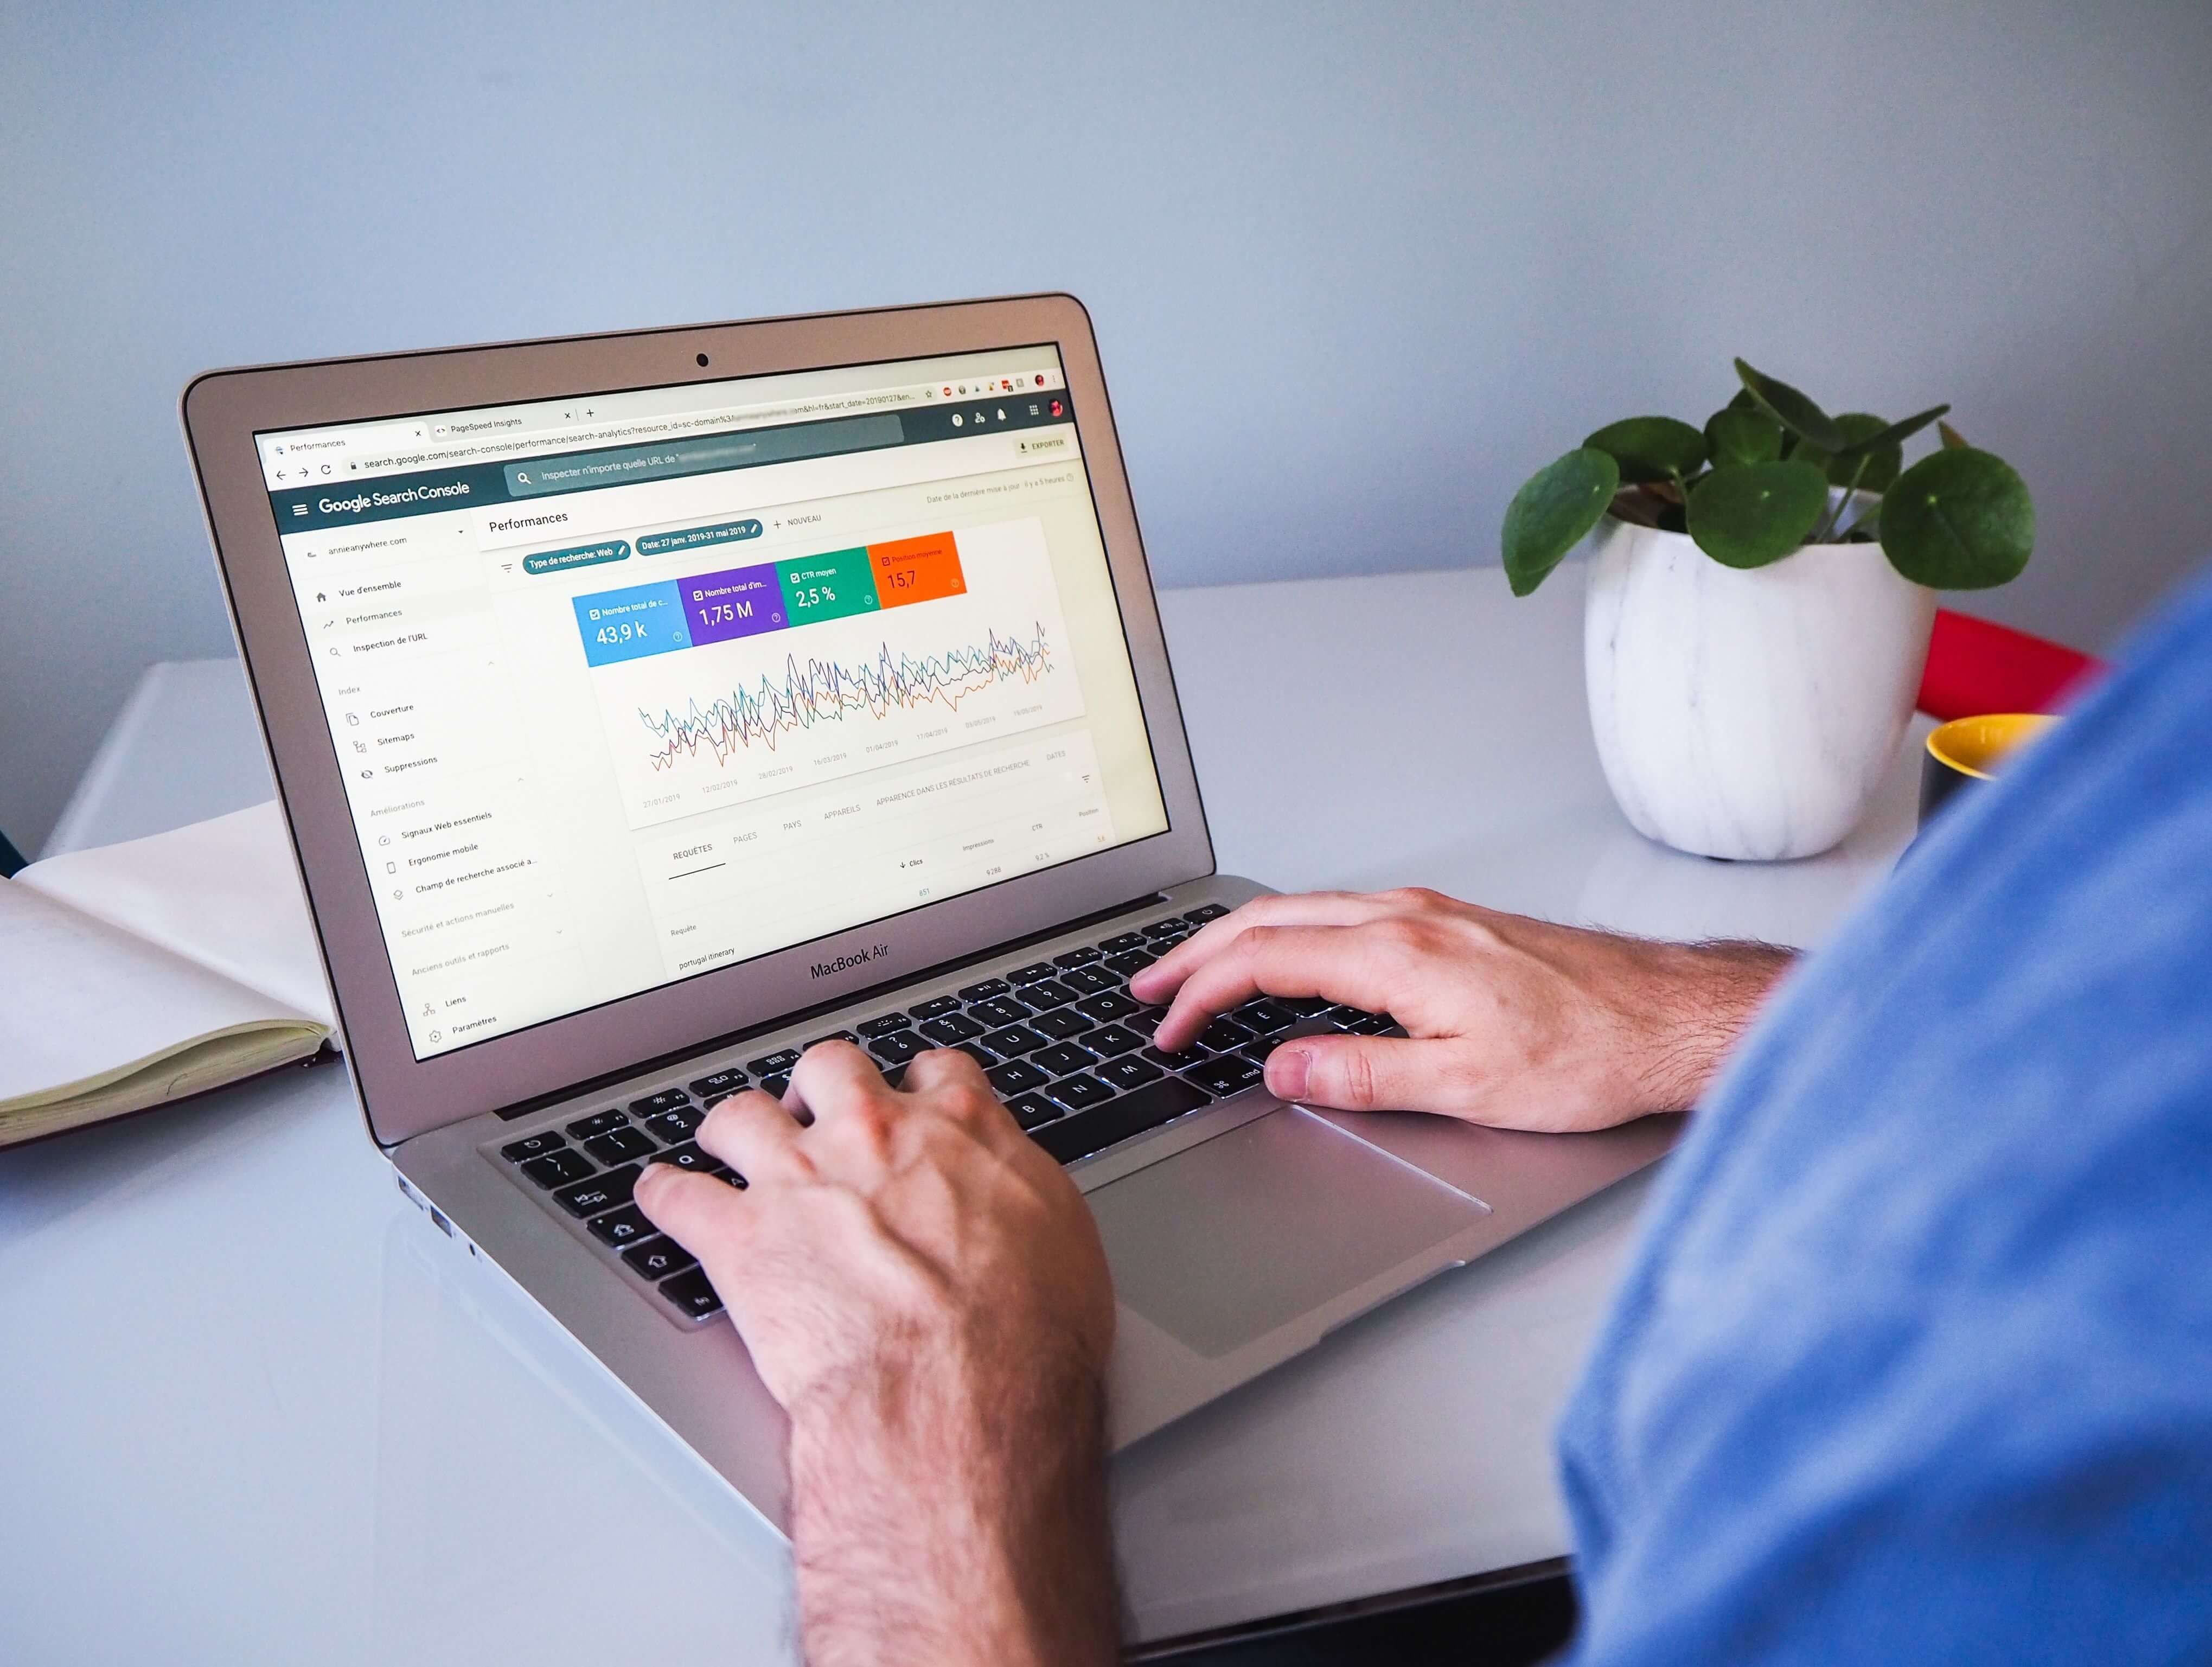
USING POWER QUERY FOR SEO: VISUALIZING GOOGLE SEARCH CONSOLE DATA
How to use Power Query efficiently for your SEO Data Visualization ...
Read More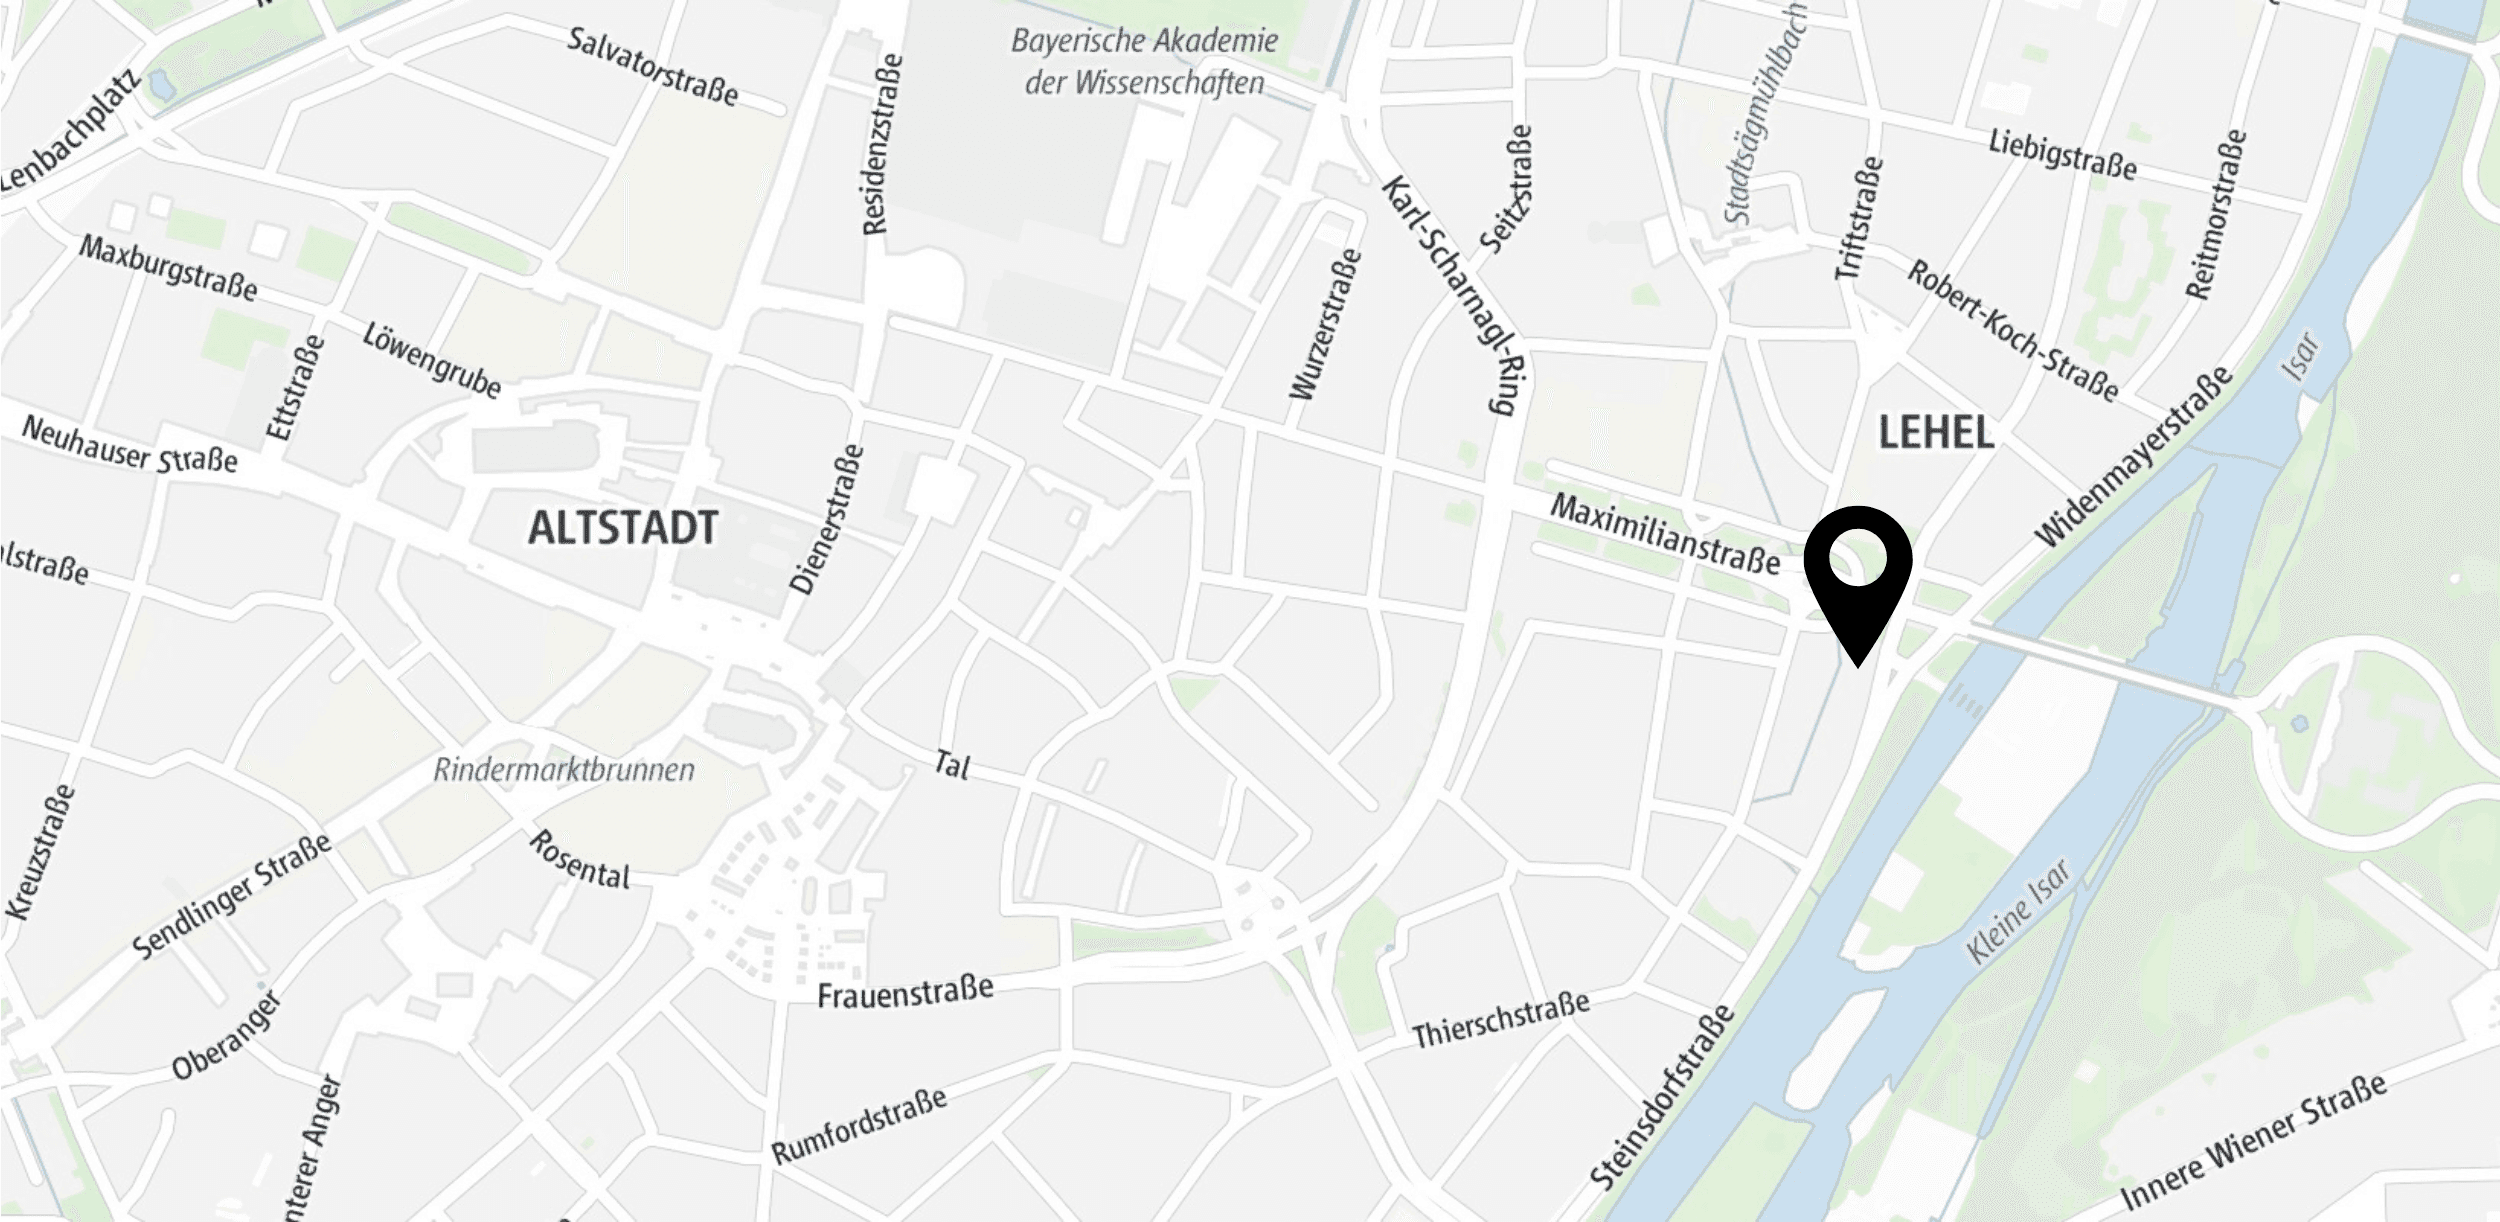
Contact Us
Via contact form, e-mail or callGet in touch with us
You can find our office in the heart of Munich:
Address: Steinsdorfstraße 2, 80538 Munich
Phone: 089 – 41 61 47 83 0
Email: contact@digital-loop.com
We are social